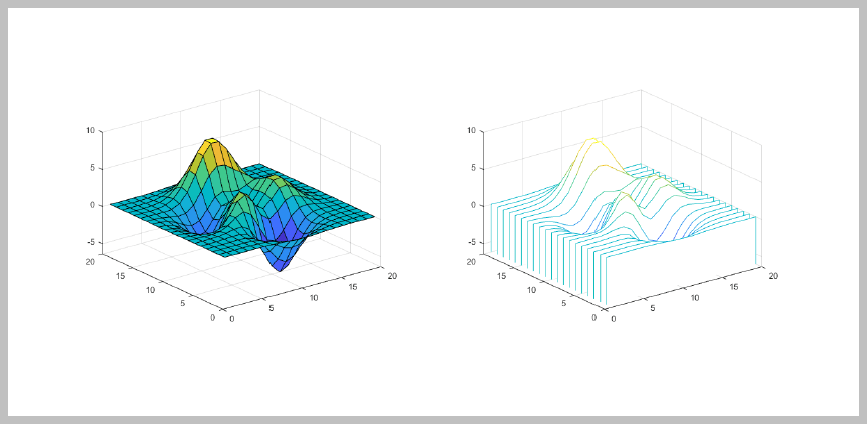
并排图
此示例显示如何在页面上并排排列图窗。
该示例将每个图窗放置在不可见表(没有边框或颜色的表)的相邻条目中。不可见的表使插入的图窗看起来并排排列。

导入 DOM 和报告 API 包,这样您就不必使用长而完全限定的类名。另外,创建一个报告对象。
import mlreportgen.dom.*
import mlreportgen.report.*

% To create a Word report, change the output type from "pdf" to "docx".
% To create an HTML report, change "pdf” to “html” or "html-file" for a
% multifile or single-file report, respectively.
rpt = Report('myreport', 'pdf');
为表面(图 1)和瀑布(图 2)图创建图窗对象。然后,创建包装图窗快照图像文件的图像对象。缩放图像以适合下面创建的表条目。
imgStyle = {ScaleToFit(true)};

fig1 = Figure(surf(peaks(20)));
fig1Img = Image(getSnapshotImage(fig1, rpt));
fig1Img.Style = imgStyle;
delete(gcf);

fig2 = Figure(waterfall(peaks(20)));
fig2Img = Image(getSnapshotImage(fig2, rpt));
fig2Img.Style = imgStyle;
delete(gcf);
将图像插入 1x3 的不可见布局表 (lo_table) 的唯一行中。如果未定义表及其所有表条目的边框,则认为该表不可见。
lo_table = Table({fig1Img, ' ', fig2Img});仅当指定了表条目的高度和宽度时,图像的大小才会适合表条目。
lo_table.entry(1,1).Style = {Width('3.2in'), Height('3in')};
lo_table.entry(1,2).Style = {Width('.2in'), Height('3in')};
lo_table.entry(1,3).Style = {Width('3.2in'), Height('3in')};
设置表宽度,使其跨越边距之间的页面宽度。将 ResizeToFitContents 设置为 false,这样表列的大小就不会调整,而是使用指定的宽度。
lo_table.Style = {Width('100%'), ResizeToFitContents(false)};生成并显示报告。
add(rpt, lo_table);
close(rpt);
rptview(rpt);