SimBiology.Observable
Object containing expression for post-simulation calculations
Description
An observable object is a mathematical expression that lets you perform post-simulation calculations. For example, you can define an observable expression to compute the fraction of a ligand that is bound to a receptor at each time step, or compute some statistics such as area under the curve (AUC) of a drug concentration profile. You can also use an observable object as a response in simulation, data fitting, and global sensitivity analysis.
The name of each observable object in a SimBiology® model must be unique, meaning no observable object can have the same name as
another observable, species, compartment, parameter, reaction, variant, or dose in the model.
An observable object can reference any model quantities that are logged (in
StatesToLog). It can also reference other active observable objects
provided that the expressions contain no algebraic loops. The object expression can reference
simulation time using the variable time. Follow the recommended guidelines for
expression evaluations. For instance, if a quantity name is not a valid MATLAB® variable name, enclose the name in brackets [] when referring
to it in an expression.
SimBiology evaluates the object expression using the entire time course of any referenced
states or observables. The result of an observable expression must be a numeric scalar or
vector. If it is a vector, it must be of the same length as the simulation time vector. The
result is stored in the returned SimData object. Specifically, if the
observable expression is scalar-valued, the result is stored in the
SimData.ScalarObservables property. Otherwise, it is stored in
SimData.VectorObservables.
Note
Make sure to correctly vectorize the expressions. For example, use
A./(A+B)instead ofA/(A+B)if A and B are matrices.Avoid hardcoding expressions that expect any particular number of points or times. For example, instead of using
time(1:1000), usetime(1:min(1000,numel(time))).
Creation
Create an observable object using addobservable.
Properties
Object Functions
Examples
Load the Target-Mediated Drug Disposition (TMDD) model.
sbioloadproject tmdd_with_TO.sbprojSet the target occupancy (TO) as a response.
cs = getconfigset(m1);
cs.RuntimeOptions.StatesToLog = 'TO';
Get the dosing information.
d = getdose(m1,'Daily Dose');Scan over different dose amounts using a SimBiology.Scenarios object. To do so, first parameterize the Amount property of the dose. Then vary the corresponding parameter value using the Scenarios object.
amountParam = addparameter(m1,'AmountParam','Units',d.AmountUnits);
d.Amount = 'AmountParam';
d.Active = 1;
doseSamples = SimBiology.Scenarios('AmountParam',linspace(0,300,31));
Create a SimFunction to simulate the model. Set TO as the simulation output.
% Suppress informational warnings that are issued during simulation.
warning('off','SimBiology:SimFunction:DOSES_NOT_EMPTY');
f = createSimFunction(m1,doseSamples,'TO',d)
f =
SimFunction

Parameters:

         Name          Value        Type            Units
    _______________    _____    _____________    ____________

    {'AmountParam'}      1      {'parameter'}    {'nanomole'}

Observables:

     Name         Type               Units
    ______    _____________    _________________

    {'TO'}    {'parameter'}    {'dimensionless'}

Dosed:

      TargetName                 TargetDimension                  Amount         AmountValue    AmountUnits
    _______________    ___________________________________    _______________    ___________    ____________

    {'Plasma.Drug'}    {'Amount (e.g., mole or molecule)'}    {'AmountParam'}         1         {'nanomole'}


TimeUnits: day
warning('on','SimBiology:SimFunction:DOSES_NOT_EMPTY');
Simulate the model using the dose amounts generated by the Scenarios object. In this case, the object generates 31 different doses; hence the model is simulated 31 times and generates a SimData array.
doseTable = getTable(d);
sd = f(doseSamples,cs.StopTime,doseTable)
   SimBiology Simulation Data Array: 31-by-1

   ModelName:        TMDD
   Logged Data:
     Species:        0
     Compartment:    0
     Parameter:      1
     Sensitivity:    0
     Observable:     0
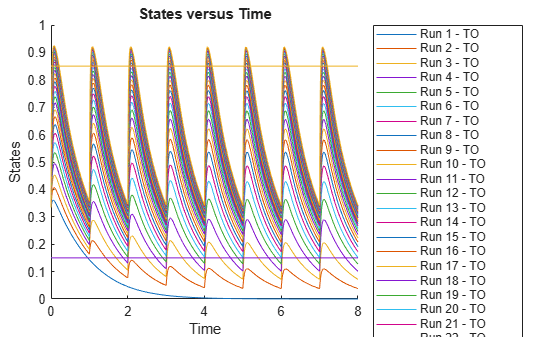
Plot the simulation results. Also add two reference lines that represent the safety and efficacy thresholds for TO. In this example, suppose that any TO value above 0.85 is unsafe, and any TO value below 0.15 has no efficacy.
h = sbioplot(sd);
time = sd(1).Time;
h.NextPlot = 'add';
safetyThreshold = plot(h,[min(time), max(time)],[0.85, 0.85],'DisplayName','Safety Threshold');
efficacyThreshold = plot(h,[min(time), max(time)],[0.15, 0.15],'DisplayName','Efficacy Threshold');
Postprocess the simulation results. Find out which dose amounts are effective, corresponding to the TO responses within the safety and efficacy thresholds. To do so, add an observable expression to the simulation data.
% Suppress informational warnings that are issued during simulation.
warning('off','SimBiology:sbservices:SB_DIMANALYSISNOTDONE_MATLABFCN_UCON');
newSD = addobservable(sd,'stat1','max(TO) < 0.85 & min(TO) > 0.15','Units','dimensionless')
   SimBiology Simulation Data Array: 31-by-1

   ModelName:        TMDD
   Logged Data:
     Species:        0
     Compartment:    0
     Parameter:      1
     Sensitivity:    0
     Observable:     1
The addobservable function evaluates the new observable expression for each SimData in sd and returns the evaluated results as a new SimData array, newSD, which now has the added observable (stat1).
SimBiology stores the observable results in two different properties of a SimData object. If the results are scalar-valued, they are stored in SimData.ScalarObservables. Otherwise, they are stored in SimData.VectorObservables. In this example, the stat1 observable expression is scalar-valued.
Extract the scalar observable values and plot them against the dose amounts.
scalarObs = vertcat(newSD.ScalarObservables);
doseAmounts = generate(doseSamples);
figure
plot(doseAmounts.AmountParam,scalarObs.stat1,'o','MarkerFaceColor','b')
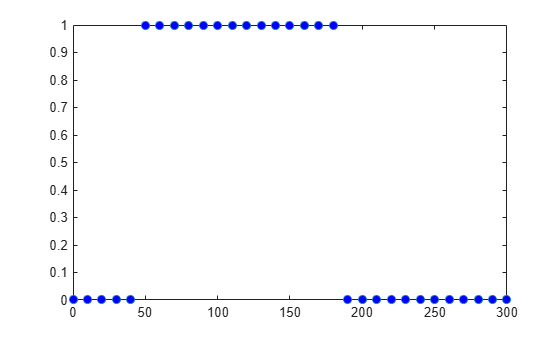
The plot shows that dose amounts ranging from 50 to 180 nanomoles provide TO responses that lie within the target efficacy and safety thresholds.
You can update the observable expression with different threshold amounts. The function recalculates the expression and returns the results in a new SimData object array.
newSD2 = updateobservable(newSD,'stat1','max(TO) < 0.75 & min(TO) > 0.30');
Rename the observable expression. The function renames the observable, updates any expressions that reference the renamed observable (if applicable), and returns the results in a new SimData object array.
newSD3 = renameobservable(newSD2,'stat1','EffectiveDose');
Restore the warning settings.
warning('on','SimBiology:sbservices:SB_DIMANALYSISNOTDONE_MATLABFCN_UCON');
Version History
Introduced in R2020a