Simulation of a Medical Device
This example shows how to conduct automated tests to model a medical device that analyzes biology samples. This example also requires a Stateflow® license.
Objective
The objective of medical device modeling is to assess the optimal dimensions of the sample area to maximize the number of samples analyzed by the device per hour.
Overview of System to Be Modeled
A medical device contains:
Samples to be analyzed
Reagent bottles
The vials that hold the samples to be analyzed are loaded on the left side of the device. The reagent bottles are loaded on the right side of the device.
Process of Sampling for a Specific Test
The sample is mixed with the corresponding reagent in a cuvette.
The mixture sits for a certain duration for the reagent to act on the sample.
To take readings of the mix, the device shines a laser on the mixture.
See ''Automation Workflow Using Three Robot Arms'' to see how a medical device uses three robot arms to implement this process as an automated workflow.
Automation Workflow Using Three Robot Arms
Robot arm 1 picks up a cuvette and places it in the testing area at the top.
Robot arm 2 draws a sample and puts it into the cuvette.
To create a mixture to be sampled, robot arm 3 draws the required amount of reagent corresponding to the test and puts it into the cuvette.
The mixture sits for a short duration to allow the reagent to act on the sample.
To take readings, the device shines a laser light on the mixture.
The device discards the cuvette.
This process is repeated until there are no more samples in the device.
Model of Medical Device: This is the SimEvents® model for the medical device:
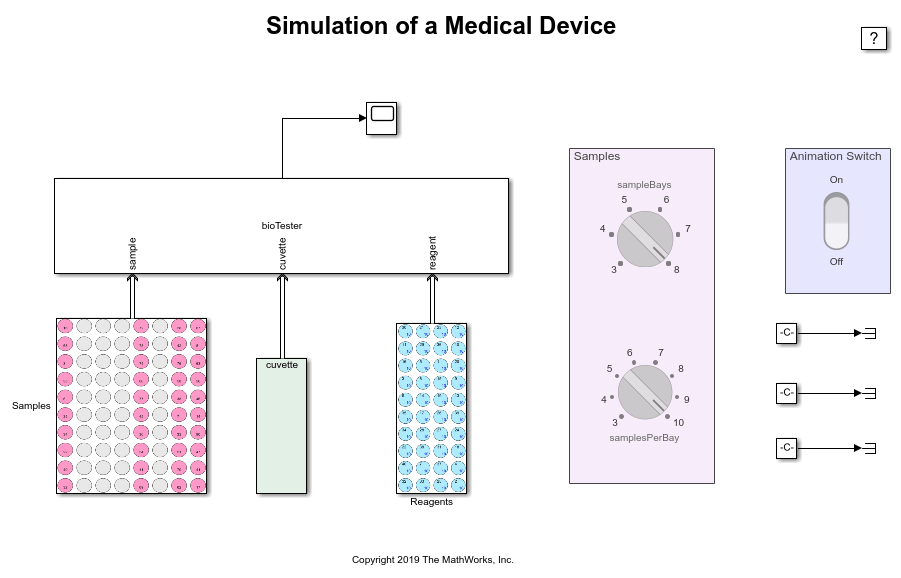
To modify the number of samples before starting to simulate, turn the knobs in the 'Samples' block.
A sample bay is a device that contains holders to hold samples. To specify the number of sample bays to use, turn the knob that changes the variable 'nSampleBays'.
To specify the number of samples that a sample bay can take, turn the knob that changes the variable 'samplesPerBay'.
The Model Has Three Primary Elements:
Model samples
Test data
Model animation The model runs the length of the specified samples and dimensions. The model animation visualizes the simulation and allows you to interact with the simulation.
Model Samples
The block labeled 'Samples' models the sample holding area. At simulation start, the reagents area is loaded with all the reagents. The cuvette area is loaded with cuvettes. The sample area is loaded with patient samples.
Test Data
'BioSampleAnalyzerData.xlsx' contains tests requested by patients. It contains these worksheets:
'PatientTests' - Patient IDs and test IDs of the tests to be conducted.
'TestData' - Details of each test. For each test ID it contains information about the amount of sample to be used (sampleAmount), the reagent to be used (reagentId), the amount of reagent to be used (reagentAmount), the priority for the test, and the amount of time the mixture must stay together (testTime) before taking a reading.
'TestNames' - List of names for the reagents.
Model Animation
To view and interact with the model using animation, click the switch on the 'Animation Switch' block. Clicking the switch 'On' opens the 'Hematology Diagnostic Instrument' window. If you do not use model animation, the example runs until the end.
The 'Hematology Diagnostic Instrument' Window Contains:
Three robot arms at the top.
Time - which displays elapsed time.
Throughput - which displays the samples/hr of the device.
Cuvette area - where cuvettes are placed. The number of remaining cuvettes is shown at the top of the cuvette area.
Reagents area - where reagents are kept. Reagents display as blue circles. The top of each reagent circle displays an abbreviation of the reagent. The bottom of each circle displays the amount of remaining reagent. When the amount of remaining reagent falls below 3 units, the amount of remaining reagent displays in red. To refill a reagent ball, click it. When a test is skipped due to an insufficient amount of reagent, the corresponding reagent is highlighted in yellow.
Samples area - where samples are kept. Samples display as pink balls. The top of each sample circle displays the testID. The bottom right of each sample circle displays the sample priority; the lower the number, the higher the priority. Samples are tested in order, highest priority to lowest priority. If a sample is waiting for a reagent to refill, the ball turns yellow. The model skips that sample and proceeds to the next sample until it can no longer continue. When a sample is completed, the ball turns orange. At the bottom of each sample column is a number indicating the sample bay. To test all the samples in a bay, click the corresponding sample bay number.
Things to Try
Change the number of samples.
Configure the parameters for the bioTester block.
Sample - Change the 'Number of sample bays' and the 'Number of samples per bay' values for the samples area.
Timing - Change timing related value, such as velocities for the robots and other timing related values.
Toggle the 'Animation Switch'.
Toggling the switch to 'Off' runs the simulation until all the samples are exhausted.
Toggling the 'Animation Switch' 'On' shows the animation window. In this mode, you can interact with the simulation. To load samples, click one of the buttons at the bottom of a column that corresponds to a sample bay. When the button is clicked, sample data is read from the workspace variable 'patientTests' and the balls in the bay corresponding to the button are populated with samples. You can continue clicking the buttons.
Evaluating the Best Sample Area Dimensions
One of the objectives of a Medical Device builder might be to determine the sample area size that gives the best throughput for the device. One consideration is that increasing the size of the sample area adds to the amount of time it takes the robot arm to reach the samples that are furthest away. Reducing the size of the sample area reduces the travel time of the robot arm. There is however a fixed setup time required to load all the sample bays, follow the device initialization procedures, and turn on the device. This setup time is amortized across all samples. If the number of samples is low, the setup time adds to the overall throughput.
To find the best sample area dimensions, you can simulate the device with different sample area size configurations. The script searchDim.m performs searches across all the possible sample area dimensions and plots the throughput for each sample area dimension. The script calculates the throughput as:
Throughput = (Number of samples)/(time to finish samples * 3600)
The following plots show the results of running this script:
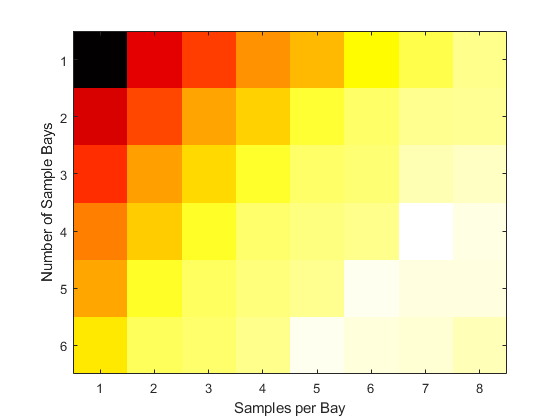
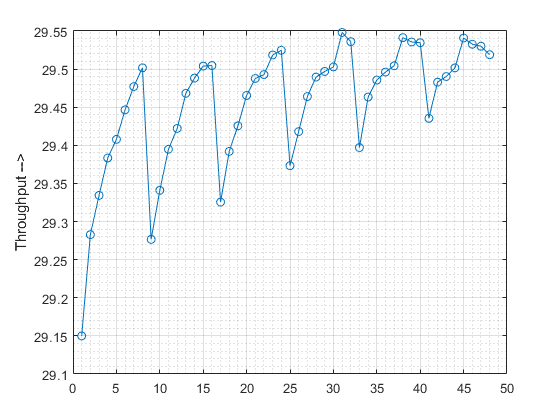
The first plot shows a Heat Map of throughput with 'samples per bay' along the horizontal and 'number of sample bays' along the vertical axis. The second plot shows a line plot of 'sample throughput' vs. 'number of samples'. As seen from these figures, the throughput for the dimensions corresponding to 6 bays and 9 samples per bay gives the highest throughput.
See Also
Topics
- Delay Entities with a Custom Entity Storage Block
- Create a Custom Entity Storage Block with Iteration Event
- Custom Entity Storage Block with Multiple Timer Events
- Custom Entity Generator Block with Signal Input and Signal Output
- Build a Custom Block with Multiple Storages
- Create a Custom Resource Acquirer Block