Compressor Map with Scattered Lookup
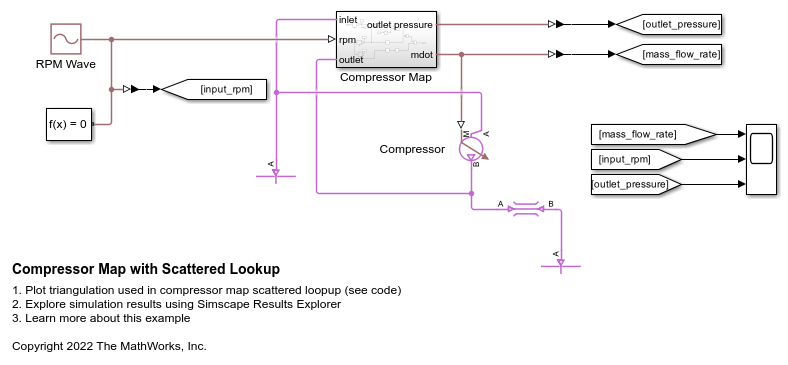
This example shows gas flow through a compressor which is modeled using a simple controlled mass flow rate source. The compressor map that governs this mass flow rate is modeled using the PS Scattered Lookup (2D) block whose data coordinates are the pressure ratio (Pa/Pa) and the engine RPM, and the output is the mass flow rate (kg/s). The scattered lookup block performs delaunay triangulation on the input data (which is shown in plots below), and uses this to interpolate and calculate the mass flow rate based on the input. Scattered lookup allows modeling of the compressor even if the data provided is in an unstructured format.
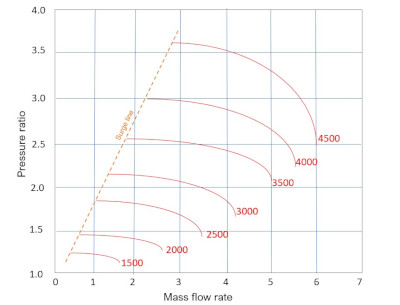
A sample compressor map is shown in the figure. For this example, one can choose any set of points along the various RPM lines as input data points for the PS Scattered Lookup block. The first coordinate is the pressure ratio and the second coordinate is the RPM value. The function value is the corresponding value of the mass flow rate.
Model
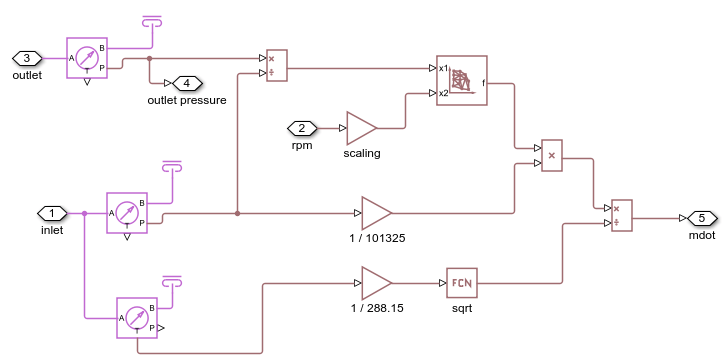
Compressor Map Subsystem
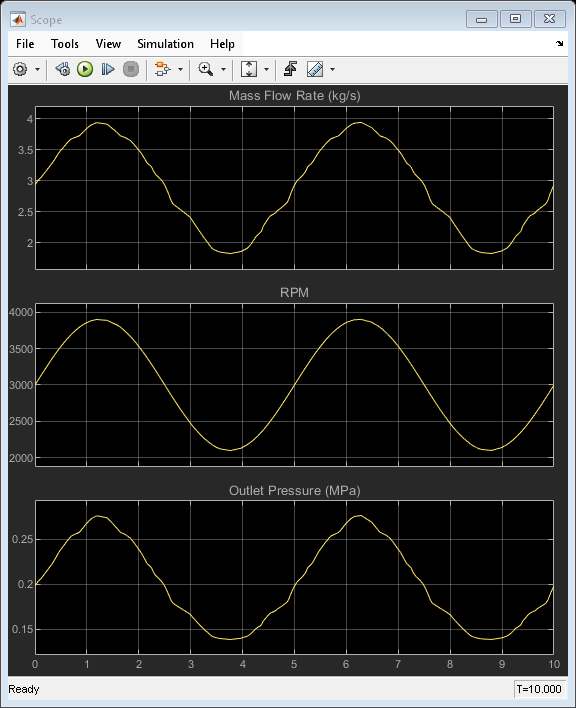
Simulation Results from Scopes
In this example, a sinusoidal input of RPM is provided to the compressor and the flow resistance based on a pressure drop and mass flow rate in the range of the compressor map is set. As the RPM changes, so does the mass flow rate, which then changes the outlet pressure which is also plotted in the Scope.
Simulation Results from Simscape Logging
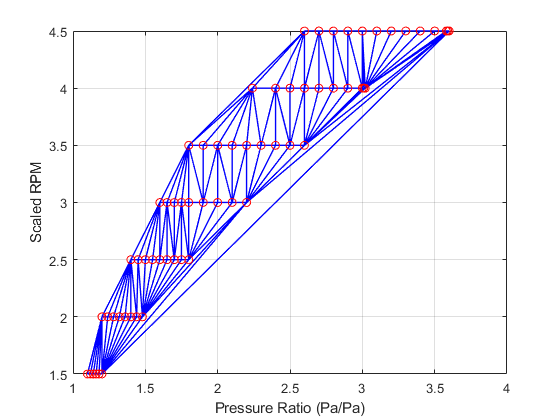
This plot shows how the provided data is triangulated for the SluCompressorMapExample. The x1 coordinate is the pressure ratio and the x2 coordinate is the scaled RPM. This triangulation is what is used by scatteredlookup to interpolate or extrapolate query values in the compressor map. The function value is the mass flow rate.
See Also
PS Scattered Lookup Table (2D)