Create Signal
Description
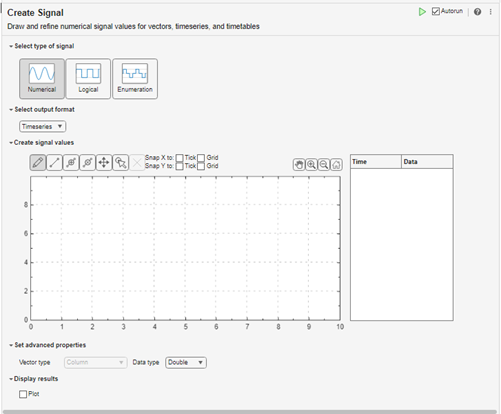
The Create Signal task lets you create numerical, logical, and enumeration data. The task automatically generates MATLAB® code for your live script.
Using this task, you can interactively draw and refine numerical data values for vectors, timeseries, timetables, and data arrays using:
Pointer
Keyboard
Touchscreen
By default, the live task creates a timeseries or
timetable workspace variable, createdSignal. You can use
the createdSignal
timeseries or timetable object data in Simulink® or MATLAB. Examples include Root Inport Mapper, Signal Editor, Simulink source blocks, or any application or live task that works with timeseries or timetable objects.
For general information about Live Editor tasks, see Add Interactive Tasks to a Live Script.
Open the Task
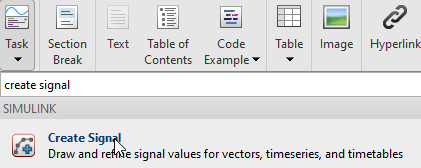
To add the Create Signal task to a live script in the MATLAB Editor:
On the Live Editor tab, select Task > Create Signal.
In a code block in the script, type a relevant keyword, such as
create signal,vector,timeseries,timetable,input,signal, orsource. From the selected completions, select Create Signal.
Examples
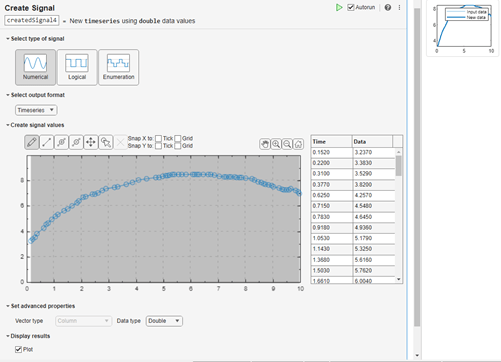
This example shows how to use the Create Signal Live Editor task to create numerical data by drawing an arc. By default, Create Signal creates a variable named createdSignal in the workspace with a numerical signal type and outputs data in the timeseries format.
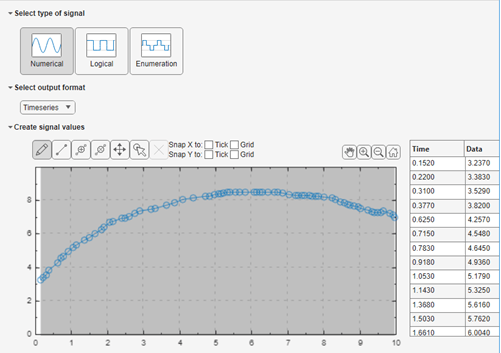
In the Create signal values section, click ![]() , then left-click and drag to create a line of data points.
, then left-click and drag to create a line of data points.
To the right of the window, observe the time and data points that result from the drawing.
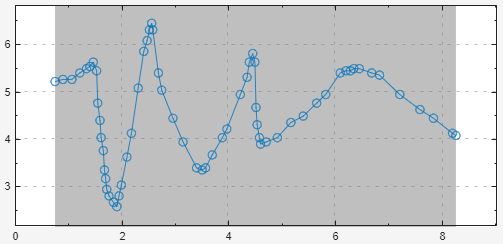
To view a plot of the line, in the Display results section, click Plot. The plot displays to the right.

To see the code that this task generates, expand the task display by clicking ![]() at the bottom of the task parameter area.
at the bottom of the task parameter area.
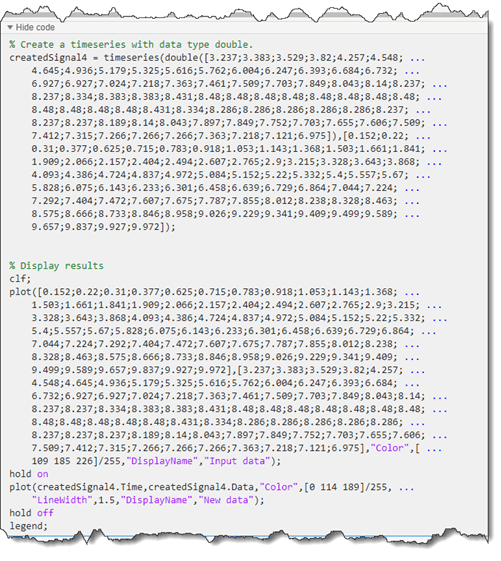
You can use the createdSignal timeseries object data in many of the cases where you want to input data, for example, to import to Root Inport Mapper or to work with source blocks. To save this task, save the live script.
This example shows how to use the Create Signal Live Editor task to create numerical data for an inport port in a model by drawing an arc. By default, Create Signal creates a variable named createdSignal in the workspace with a numerical signal type and outputs data in the timeseries format.
In the Create signal values section, click ![]() , then left-click and drag to create a line of data points.
, then left-click and drag to create a line of data points.
To the right of the window, observe the time and data points that result from the drawing.

To view a plot of the line, in the Display results section, click Plot. The plot displays to the right.
At the bottom of the live task, add the code to open the CreateSignalInport model, set the createdSignal variable to the input, load the input from the workspace, and simulate the model.
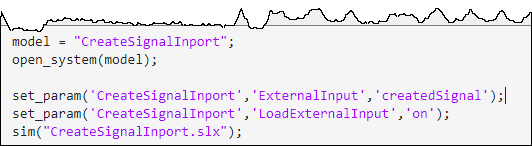
In the live task, click Run.
In the model, open the Scope block.
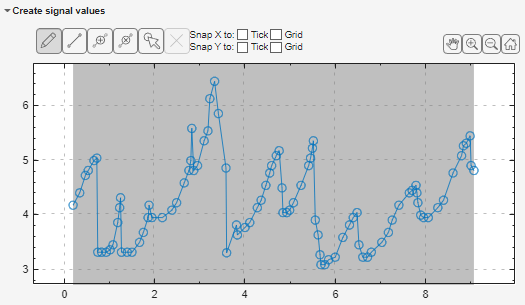
This example shows how to move one signal point, two signal points, or an entire plot in a Create Signal live task.
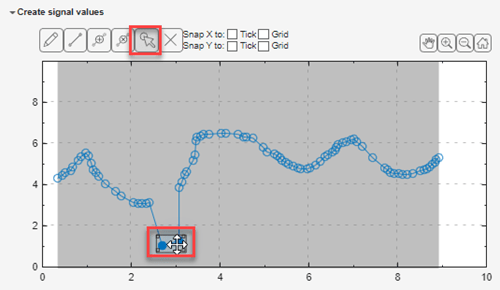
Move One Point
On the Live Editor tab, select Task > Create Signal.
Create a plot. In the Create signal values section, click ![]() , then left-click and drag to create a line of data points.
, then left-click and drag to create a line of data points.
Click the Select and Move point(s) ![]() button. This action persists until you select another action.
button. This action persists until you select another action.
Click a point. The move icon ![]() appears on top of the point.
appears on top of the point.
Drag the point to another area of the plot.
Tip: You cannot drag the point horizontally past adjacent points.

Move Two Points
On the Live Editor tab, select Task > Create Signal.
Create a plot. In the Create signal values section, click ![]() , then left-click and drag to create a line of data points.
, then left-click and drag to create a line of data points.
Click the Select and Move point(s) ![]() button. This action persists until you select another action.
button. This action persists until you select another action.
Click a point. To select another contiguous point, you can:
Click anywhere on the line between the two contiguous points.
Drag to the other point on the same line.
The move icon ![]() appears on top of the points.
appears on top of the points.
Drag the points to another area of the plot.
Tip: You cannot drag the points horizontally past adjacent points.
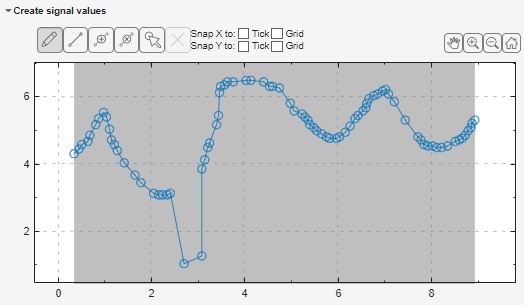
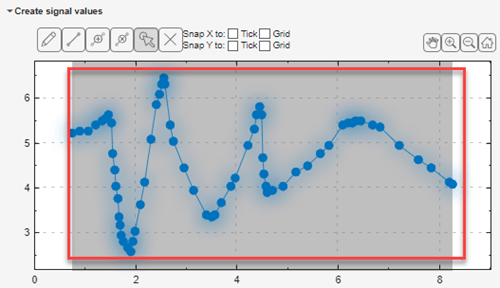
Move Entire Plot
On the Live Editor tab, select Task > Create Signal.
Create a plot. In the Create signal values section, click ![]() , then left-click and drag to create a line of data points.
, then left-click and drag to create a line of data points.
Click the Select and Move point(s) ![]() button. This action persists until you select another action.
button. This action persists until you select another action.
Select the entire plot. Alternatively, double-click anywhere on the plot.
The move icon ![]() appears on top of the plot.
appears on top of the plot.
Related Examples
Parameters
Type of data to create, specified as Numerical,
Logical, or Enumeration.
Data type of the created data, specified as Timeseries,
Data array, Timeseries, and
Timetable.
Interactively create signals using the palette of mouse and touchscreen actions. The interactively created data is plotted in the plot area. You can refine this data or create new data by:
Editing the data in the Time Data table using the keyboard
Manipulating the points in the plot using the pointer or touchscreen
| Action | Keyboard | Pointer | Multi-Touch |
|---|---|---|---|
Insert point | Ctrl+P | Click | Tap |
Insert line | Ctrl+L | Click | Pan and pinch |
Select a point | Ctrl+T | Click To select all areas, double-click | Pan and pinch To select all areas, double-tap |
Move a point | Ctrl+M | Click | Tap and move |
Continuously delete points on a line | Click | ||
Draw | Click | Pan | |
Zoom in, zoom out | Click
. | ||
Home | Click
. | ||
Pan in x-axis, y, and x- and y-axes | Click
. | ||
Expand along x-axis | Ctrl+pointer pan | Touch and drag along the x-axis in opposite directions | |
Expand along y-axis | Shift+pointer pan | Touch and drag along the y-axis in opposite directions | |
Snap X or Y to tick | |||
Snap X or Y to grid |
Set up the properties for your data. The data properties depend on the Select type of signal and Select output format settings. Depending on these settings, you can set properties such as:
Vector type
Data type
Variable names
Time units
To plot the data, select the Plot check box. The plot displays to the right.
Version History
Introduced in R2022bThe Create Signal
Move button ![]() has been replaced by the Select and Move
point(s) button
has been replaced by the Select and Move
point(s) button ![]() . The move action is now combined with the select action.
This button enables you to select and move one signal point, two contiguous signal points on
the same line, or the entire plot. In releases prior to R2024a, the
Move button enabled you to move only the entire plot.
. The move action is now combined with the select action.
This button enables you to select and move one signal point, two contiguous signal points on
the same line, or the entire plot. In releases prior to R2024a, the
Move button enabled you to move only the entire plot.