Design Custom Displays
This example shows how to use the Display block from the Customizable Blocks library to design two displays:
An odometer
A thermostat display
The blocks in the model use PNG images as the background for the displays. You can find all images used to create the displays in the example directory, in the CustomDisplayImages folder.
Design Odometer
To design the odometer, add a customizable Display block to the model using the Simulink® quick insert menu:
To open the quick insert menu, double-click in the canvas.
To search for the customizable Display block, type
Display.Select the search result with the library path
Simulink/Dashboard/Customizable Blocks.
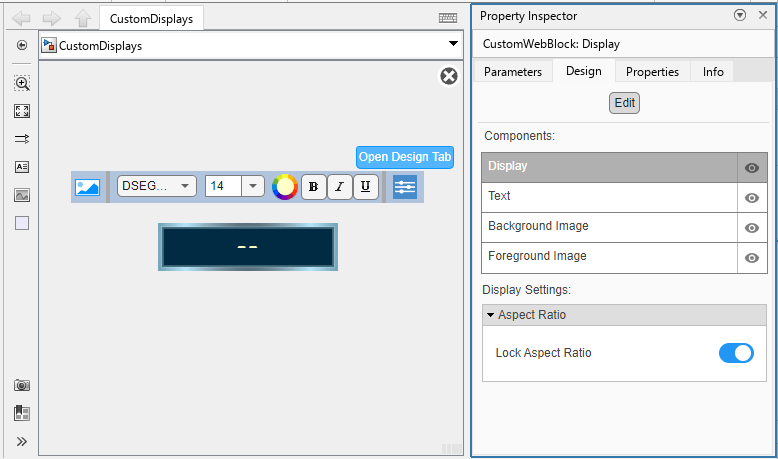
To customize the Display block, enter design mode:
In the model canvas, select the block.
In the Simulink Toolstrip, click the Display tab.
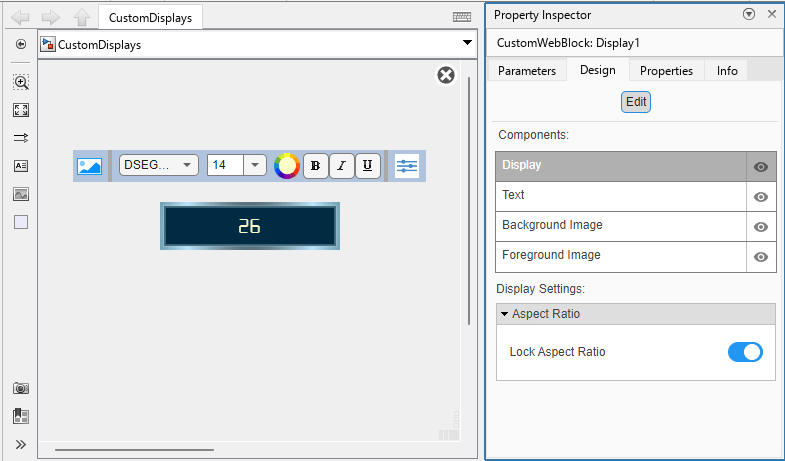
On the Display tab, click Edit. A toolbar with customization options appears above the block.
You can also customize the block using the Design tab of the Property Inspector. To open the Design tab, in the toolbar above the block, click Open Design Tab.
In this example, you use both the toolbar and the Design tab to customize the block.
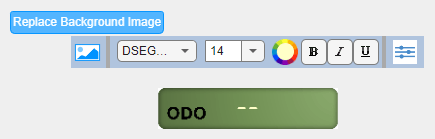
Add the background image for the odometer:
In the toolbar above the Display block, click the Replace Background Image button.
In the
CustomDisplayImagesfolder, select theodometer-background.pngfile.
Increase the size of the odometer.
Exit design mode. In the Property Inspector, on the Design tab, click Edit.
Drag a corner of the block outward until the text
ODOis large enough to read.

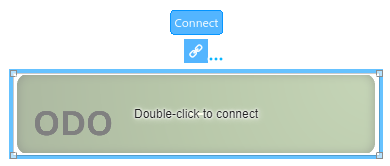
In the model, the output signal of a Ramp block represents the current odometer reading. The output port of the Ramp block connects to a signal line named odometer. Connect the Display block to the signal line to see how the displayed value looks during simulation.
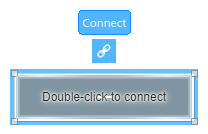
Select the Display block.
Click the Connect button that appears above the block.
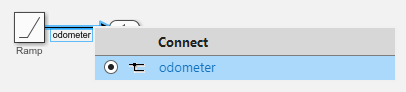
Select the signal line named
odometer.Select the
odometeroption in the table that appears below the selected signal.Click the
Xin the upper-right corner of the Simulink window.
Simulate the model. This model uses simulation pacing to slow model execution so you can clearly see the displayed value changing during simulation. For more information about simulation pacing, see Simulation Pacing Options.

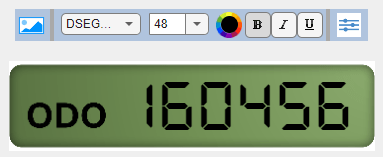
Customize the font.
Enter design mode. Select the Display block. In the Property Inspector, on the Design tab, click Edit.
In the toolbar above the block, click the Set Color button and select black.
Set the font size to
48.Make the font bold by selecting B.
In the Property Inspector, on the Design tab, select the Text component. In the Size and Position section, adjust the X Offset value such that the right edge of the displayed number is at the right edge of the block.
Adjust the Y Offset value such that the bottom of the displayed number lines up with the bottom of the
ODOtext.
Exit design mode. In the Property Inspector, on the Design tab, click Edit.
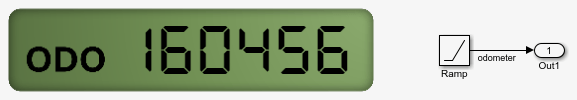
To use the finished odometer, run the simulation again and observe the displayed odometer reading change over time.
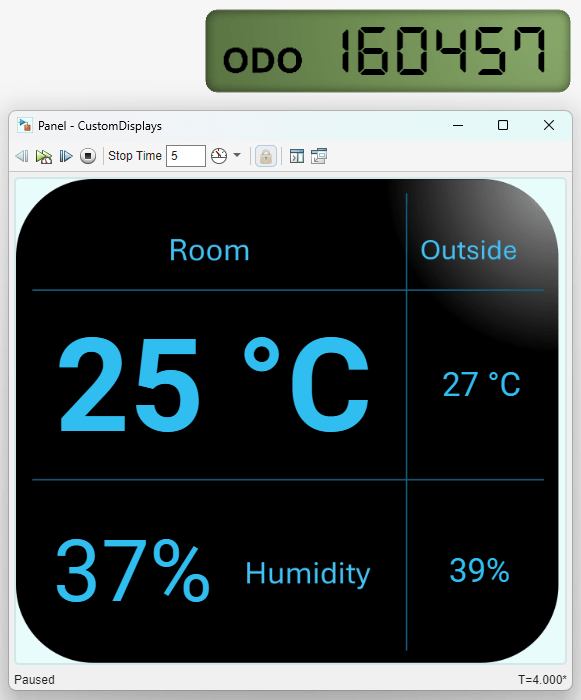
Design Thermostat Display
Design a thermostat display that shows these four values:
Room temperature
Room humidity
Outside temperature
Outside humidity
Add a customizable Display block to the model using the Simulink quick insert menu:
To open the quick insert menu, double-click in the canvas.
To search for the customizable Display block, type
Display.Select the search result with the library path
Simulink/Dashboard/Customizable Blocks.
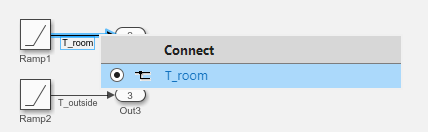
In the model, the current temperature and humidity readings are each represented by the output signal of a Ramp block. Connect the Display block to the signal line named T_room to see how the displayed value looks during simulation.
Select the Display block.
Click the Connect button that appears above the block.
Select the signal named
T_room.In the table that appears below the selected signal, select
T_room.Click the
Xin the upper-right corner of the Simulink window.
Simulate the model. This model uses simulation pacing to slow model execution to see the displayed value changing during simulation. For more information about simulation pacing, see Simulation Pacing Options.

To customize the Display block, enter design mode:
In the model canvas, select the block.
In the Simulink Toolstrip, click the Display tab.
On the Display tab, click Edit. A toolbar with customization options appears above the block.
You can also customize the block using the Design tab of the Property Inspector. To open the Design tab, in the toolbar above the block, click Open Design Tab.
In this example, you use both the toolbar and the Design tab to customize the block.
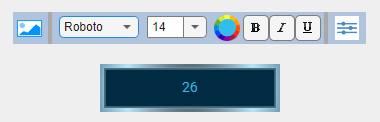
Customize the font.
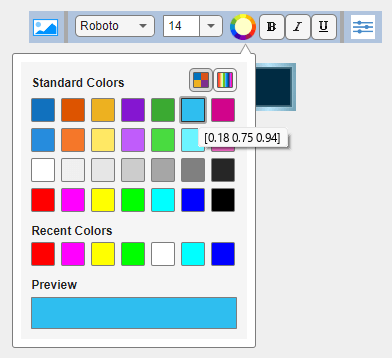
In the toolbar above the Display block, change the font to
Roboto.Click the Set Color button and select the blue color with the RGB values [0.18 0.75 0.94]. To see the RGB value of a color, pause on the color.
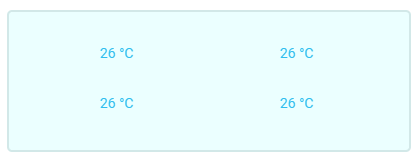
Remove the block background image. In the Property Inspector, on the Design tab, select the Background Image component. In the Select Image section, click X.
Exit design mode. In the Property Inspector, on the Design tab, click Edit.

Add units to the displayed value.
In the Property Inspector, on the Parameters tab, set Format to
Custom.Set Format String to
%d °C.Press Enter.

Create three copies of the block. Position the four blocks in a grid, with the original in the upper-left corner.
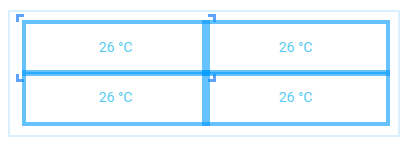
Change the connections of the blocks in the lower-left, upper-right, and lower-right positions. For each block:
Select the block.
Pause on the ellipsis (...) that appears.
In the action menu that expands, click Connect.
To connect the signal in the lower left, select the signal named
h_room. To connect the signal in the upper right, select the signal namedT_outside. To connect the signal in the lower right, select the signal namedh_outside.In the table that appears below the selected signal, select the option with the same name as the signal line that you selected.
Click the
Xin the upper-right corner of the Simulink window.
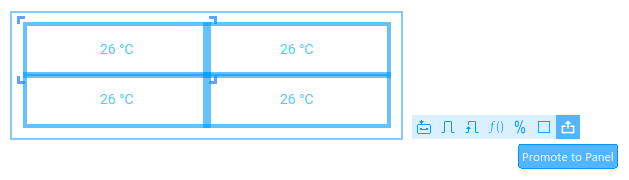
Promote all four blocks to a panel. Drag to select the blocks, then pause on the ellipsis (...) that appears. In the action bar that expands, click Promote to Panel.
Add a background image to the panel.
Enter edit mode. Select the panel. Pause on the ellipsis (...) that appears. In the action bar that expands, click Edit Panel.
In the action bar above the block, click Change Background Image. In the
CustomDisplayImagesfolder, select thethermostat-background.pngfile.
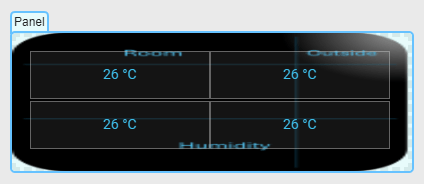
Resize the panel to roughly the dimensions shown, such that the text in the background image is clearly visible and neither stretched nor compressed.
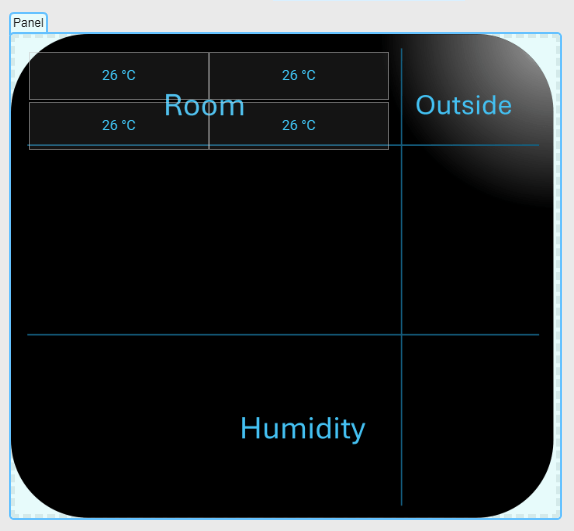
Move the block in the upper-left position into the upper-left cell of the table in the panel background image. Move the block in the lower-left position into the lower-left cell, the block in the upper-right position into the upper-right cell, and the block in the lower-right position into the lower-right cell.
If you drop a block when any part of the block is outside of the panel, the block drops onto the model canvas instead of onto the panel. To return the block to the panel, move the panel aside so that you can see the block. Move the panel by clicking and dragging any part of the panel where there is no block. Then, drag the block back onto the panel, and make sure that the block is completely on the panel before you drop the block.
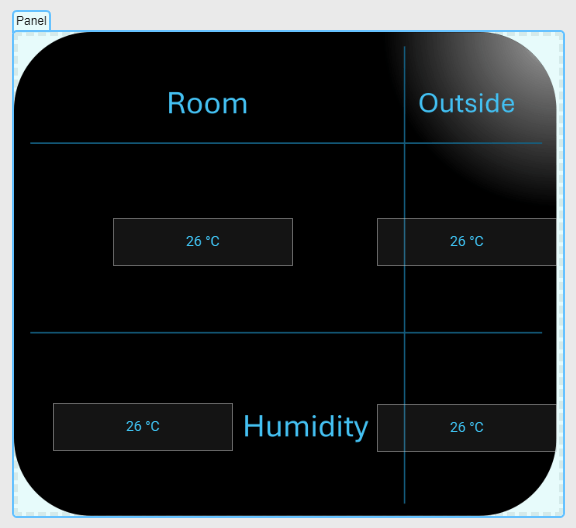
Resize the panels by dragging and pressing Shift. Resize the blocks such that the blocks are the same size as their cells. Then, horizontally resize the block in the lower-left cell such that the right-edge of the block touches the left edge of the text Humidity in the cell.
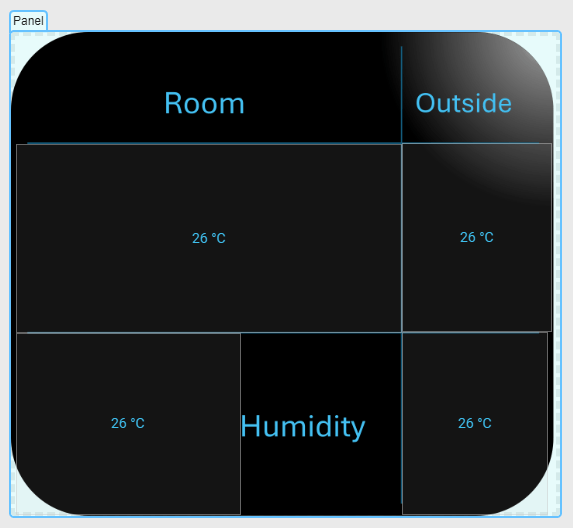
Configure the block in the upper left cell.
Exit edit mode by clicking anywhere on the model canvas.
Enter design mode. Select the block. In the Property Inspector, on the Design tab, click Edit.
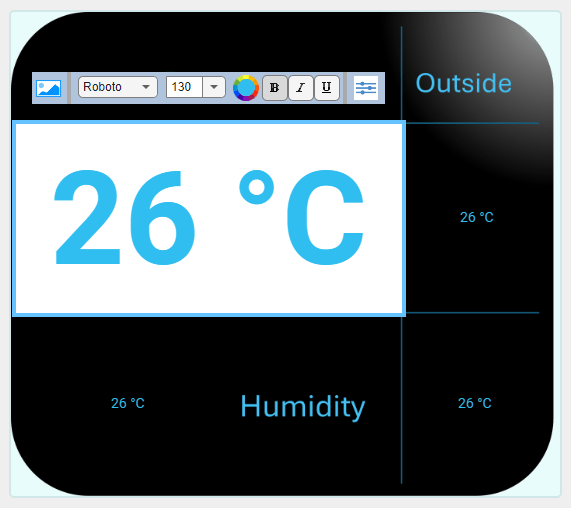
In the toolbar above the block, increase the font size such that the displayed value fills the cell. To enter a custom font value, double-click the font size displayed in the toolbar, type a new value, and press Enter.
Make the font bold by selecting B.
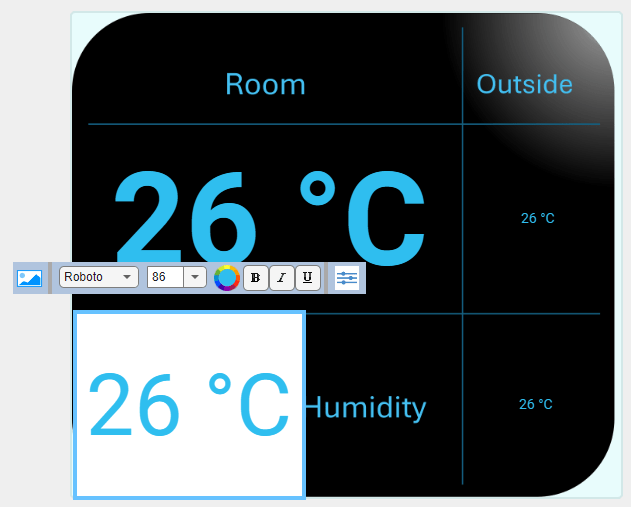
Configure the block in the lower-left cell. Resize the font of the value displayed by the block in the lower-left cell to be about two thirds the size of the font of the value displayed by the block in the upper-left cell. To resize the font, click the block and adjust the font size in the toolbar above the block.
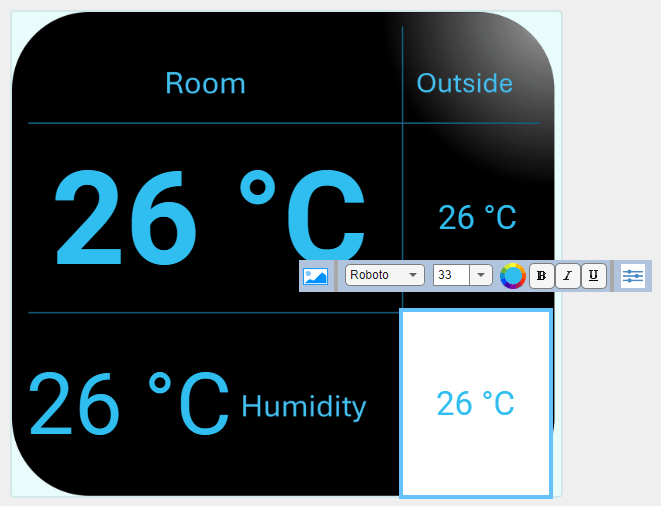
Configure the blocks in the upper- and lower-right cells. Resize the font of the values displayed by the blocks to about a quarter as big as the font of the value displayed by the block in the upper-left cell. To resize the font, click the block and adjust the font size in the toolbar above the block.
Exit design mode. In the Property Inspector, on the Design tab, click Edit.
In the values displayed by the two blocks in the bottom cells, change °C to %. For each block:
Select the block.
In the Property Inspector, on the Parameters tab, set Format String to
%d%%.Press Enter.
To use the finished thermostat, run the simulation and observe the displayed temperature and humidity readings change over time.
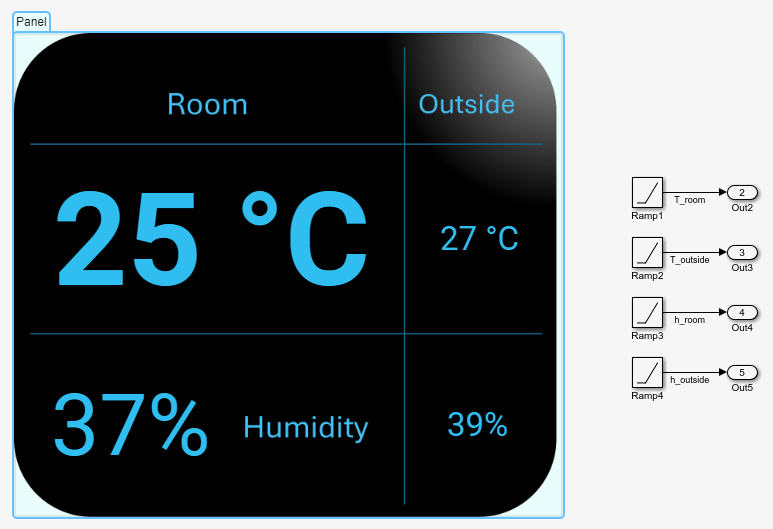
If you have not already done so, try moving the panel by clicking and dragging any part of the panel where there are no blocks. The panel floats above the model canvas. Then, drag the model canvas. The model canvas moves, but the panel stays in place. Panels allow you to monitor signals while moving through a model.
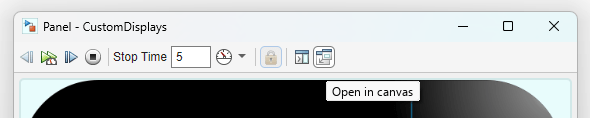
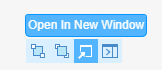
You can open a panel in a separate window from the model. Select the panel. Pause on the ellipsis (...) that appears. In the action bar that expands, click Open In New Window.
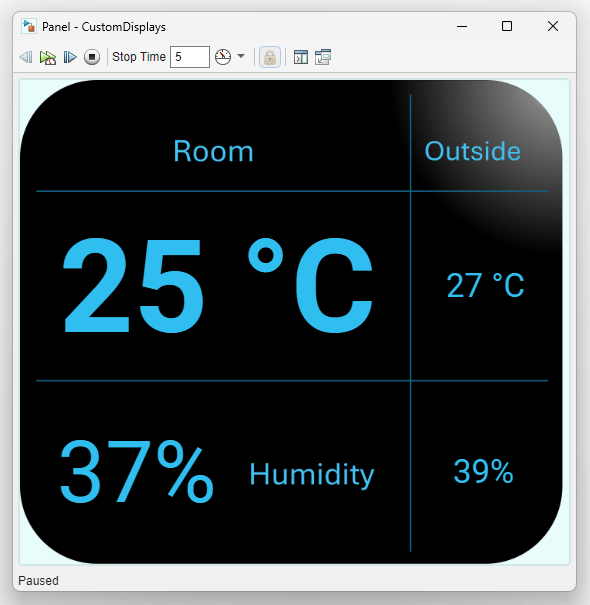
You can use the toolbar at the top of the new window to start, stop, and pause the simulation.
To return the panel to the Simulink Editor, in the toolstrip of the new window, click Open in canvas.