Use the Sequence Viewer to Visualize Messages, Events, and Entities
To see the interchange of messages and events between the blocks from the Simulink® Messages & Events library, Stateflow® charts in Simulink models, and SimEvents® blocks, you can:
Use the Sequence Viewer tool from the Simulink toolstrip.
Add a Sequence Viewer block to your Simulink model.
The Sequence Viewer allows you to visualize message transition events and the data that the messages carry. In the Sequence Viewer, you can view event data related to Stateflow chart execution and the exchange of messages between Stateflow charts. The Sequence Viewer window shows messages as they are created, sent, forwarded, received, and destroyed at different times during model execution. The Sequence Viewer window also displays state activity, transitions, and function calls to Stateflow graphical functions, Simulink functions, and MATLAB® functions.
With the Sequence Viewer, you can also visualize the movement of entities between blocks when simulating SimEvents models. All SimEvents blocks that can store entities appear as lifelines in the Sequence Viewer window. Entities moving between these blocks appear as lines with arrows. You can view calls to Simulink Function blocks and to MATLAB Function blocks.
You can add a Sequence Viewer block to the top level of a model or any subsystem. If you place a Sequence Viewer block in a subsystem that does not have messages, events, or state activity, the Sequence Viewer window informs you that there is nothing to display.
For instance, open the Stateflow example sf_msg_traffic_light.
openExample("sf_msg_traffic_light")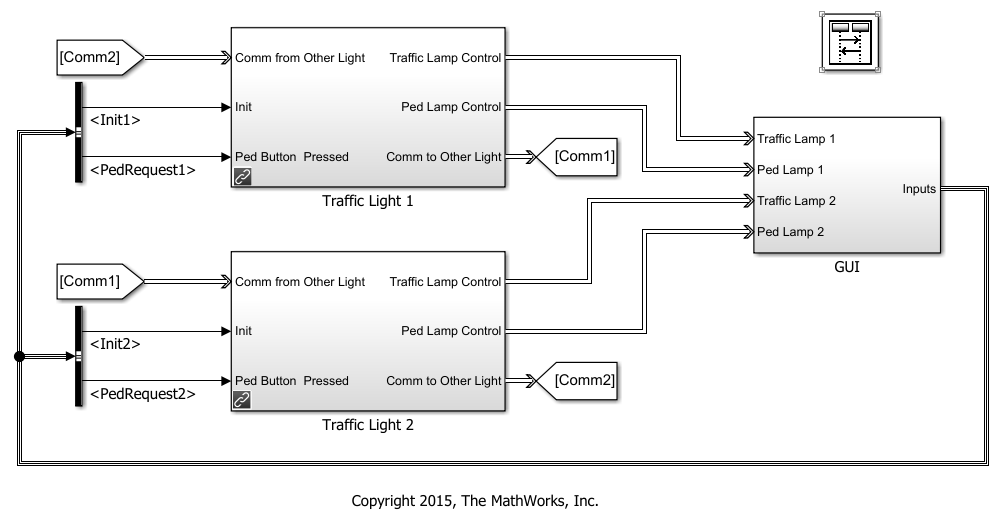
This model has three Simulink subsystems: Traffic Light 1, Traffic Light 2, and GUI. During simulation, the Stateflow charts in these subsystems exchange data by sending messages. As messages pass through the system, you can view them in the Sequence Viewer window. The Sequence Viewer window represents each block in the model as a vertical lifeline with simulation time progressing downward.

Components of the Sequence Viewer Window
Navigation Toolbar
At the top of the Sequence Viewer window, a navigation toolbar displays the model hierarchy path. Using the toolbar buttons, you can:
 Show or hide the Property
Inspector.
Show or hide the Property
Inspector. Select an automatic or manual
layout.
Select an automatic or manual
layout. Show or hide inactive
lifelines.
Show or hide inactive
lifelines. Save Sequence Viewer
settings.
Save Sequence Viewer
settings. Restore Sequence
Viewer settings.
Restore Sequence
Viewer settings. Configure Sequence
Viewer parameters.
Configure Sequence
Viewer parameters. Access the Sequence
Viewer documentation.
Access the Sequence
Viewer documentation.
Property Inspector
In the Property Inspector, you can choose filters to show or hide:
Events
Messages
Function Calls
State Changes and Transitions
Header Pane
The header pane below the Sequence Viewer toolbar shows lifeline headers containing the names of the corresponding blocks in a model.
Gray rectangular headers correspond to subsystems.
White rectangular headers correspond to masked subsystems.
Yellow headers with rounded corners correspond to Stateflow charts.
To open a block in the model, click the name in the corresponding lifeline header. To show or hide a lifeline, double-click the corresponding header. To resize a lifeline header, click and drag its right-hand side. To fit all lifeline headers in the Sequence Viewer window, press the space bar.

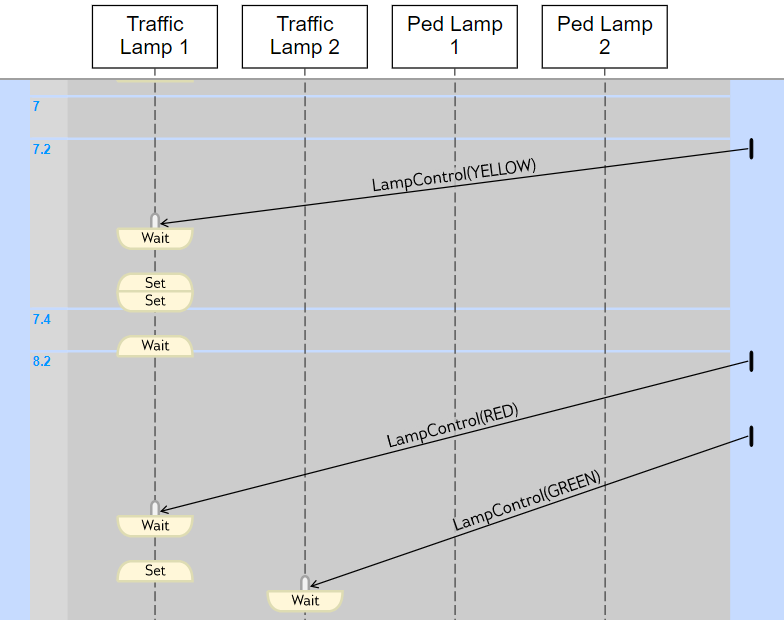
Message Pane
Below the header pane is the message pane. The message pane displays messages, events, and function calls between lifelines as arrows from the sender to the receiver. To display sender, receiver, and payload information in the Property Inspector, click the arrow corresponding to the message, event, or function call.

Navigate the Lifeline Hierarchy
In the Sequence Viewer window, the hierarchy of lifelines corresponds to the model hierarchy. When you pause or stop the model, you can expand or contract lifelines and change the root of focus for the viewer.
Expand a Parent Lifeline
In the message pane, a thick, gray lifeline indicates that you can expand the
lifeline to see its children. To show the children of a lifeline, click the expander
icon ![]() below the header or double-click the parent
lifeline.
below the header or double-click the parent
lifeline.
For example, expanding the lifeline for the Traffic Light 1 block reveals two new lifelines corresponding to the Stateflow charts Ped Button Sensor and Controller.
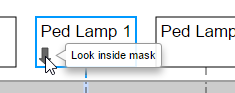
Expand a Masked Subsystem Lifeline
The Sequence Viewer window displays masked subsystems as white blocks. To show the children of a masked subsystem, point over the bottom left corner of the lifeline header and click the arrow.
For example, the GUI subsystem contains four masked subsystems: Traffic Lamp 1,Traffic Lamp 2, Ped Lamp 1, and Ped Lamp 2.

You can display the child lifelines in these masked subsystems by clicking the arrow in the parent lifeline header.
Change Root of Focus
To make a lifeline the root of focus for the viewer, point over the bottom left corner of the lifeline header and click the arrow. Alternatively, you can use the navigation toolbar at the top of the Sequence Viewer window to move the current root up and down the lifeline hierarchy. To move the current root up one level, press the Esc key.
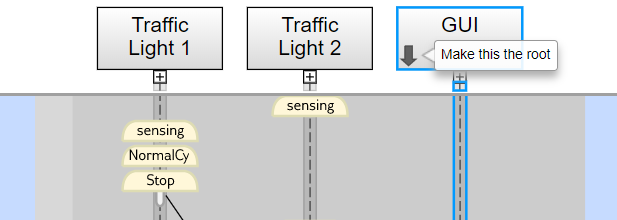
The Sequence Viewer window displays the current root lifeline path and shows its child lifelines. Any external events and messages are displayed as entering or exiting through vertical slots in the diagram gutter. When you point to a slot in the diagram gutter, a tooltip displays the name of the sending or receiving block.
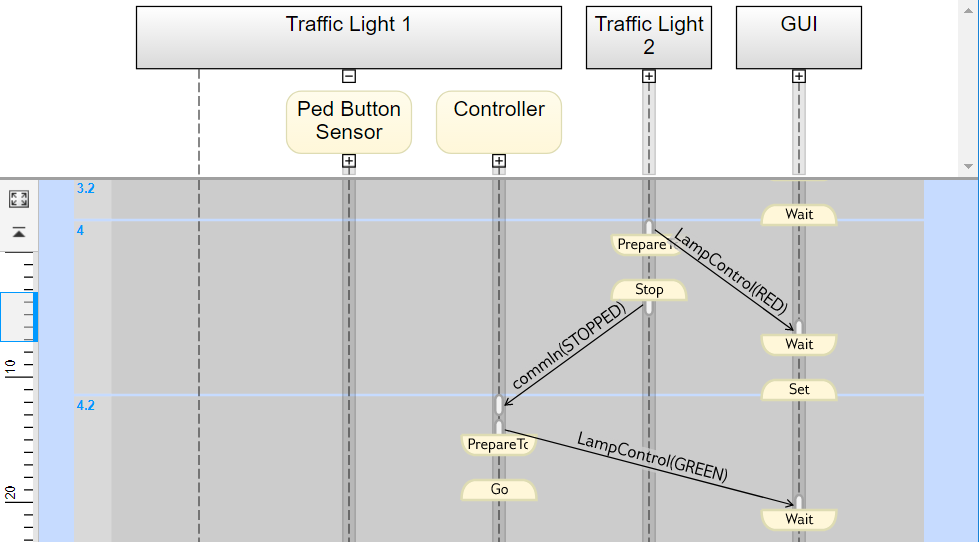
View State Activity and Transitions
To see state activity and transitions in the Sequence Viewer window, expand the state hierarchy until you have reached the lowest child state. Vertical yellow bars show which state is active. Blue horizontal arrows denote the transitions between states.
In this example, you can see a transition from Go to
PrepareToStop followed, after 1 second, by a transition to
Stop.

To display the start state, end state, and full transition label in the Property Inspector, click the arrow corresponding to the transition.
To display information about the interactions that occur while a state is active, click the yellow bar corresponding to the state. In the Property Inspector, use the Search Up and Search Down buttons to move through the transitions, messages, events, and function calls that take place while the state is active.
View Function Calls
The Sequence Viewer displays function calls and replies. This table lists the type of support for each type of function call.
| Function Call Type | Support |
|---|---|
Calls to Simulink Function blocks | Fully supported. |
Calls to Stateflow graphical or Stateflow MATLAB functions |
|
| Calls to function-call subsystems | Fully supported and displayed. |
| Calls from MATLAB Function block | Supports displaying function call events with the limitation of calls crossing model reference boundaries. |
The Sequence Viewer window displays function calls as solid arrows
labeled with the format
function_name(argument_list).
Replies to function calls are displayed as dashed arrows labeled with the format
[argument_list]=function_name.
For example, in the model slexPrinterExample, a subsystem calls the
Simulink Function block addPrinterJob. The function block
replies with an output value of false.

To open this example, enter:
openExample("slexPrinterExample")Simulation Time in the Sequence Viewer Window
The Sequence Viewer window shows events vertically, ordered in time. Multiple events in Simulink can happen at the same time. Conversely, there can be long periods of time during simulation with no events. As a consequence, the Sequence Viewer window shows time by using a combination of linear and nonlinear displays. The time ruler shows linear simulation time. The time grid shows time in a nonlinear fashion. Each time grid row, bordered by two blue lines, contains events that occur at the same simulation time. The time strip provides the times of the events in that grid row.

To show events in a specific simulation time range, use the scroll
wheel or drag the time slider up and down the time ruler. To navigate to the beginning
or end of the simulation, click the Go to first event or
Go to last event buttons. To see the entire simulation duration
on the time ruler, click the Fit to view button
![]() .
.
When using a variable step solver, you can adjust the precision of the time ruler. In the Model Explorer, on the Main tab of the Sequence Viewer Block Parameters pane, adjust the value of the Time Precision for Variable Step field.
Redisplay of Information in the Sequence Viewer Window
The Sequence Viewer saves the order and states of lifelines between
simulation runs. When you close and reopen the Sequence Viewer window, it
preserves the last open lifeline state. To save a particular viewer state, click the
Save Settings button ![]() in the toolbar. Saving the model then saves that
state information across sessions. To load the saved settings, click the
Restore Settings button
in the toolbar. Saving the model then saves that
state information across sessions. To load the saved settings, click the
Restore Settings button ![]() .
.
Note
When you update your model or rerun simulation, the Sequence Viewer clears results from past runs. To save results from past runs, use the Simulation Data Inspector.
You can modify the Time Precision for Variable Step and History parameters only between simulations. You can access the buttons in the toolbar before simulation or when the simulation is paused. During a simulation, the buttons in the toolbar are disabled.