Magnetic Levitation Controller Tuning
This example shows how to use numerical optimization to tune the controller parameters of a nonlinear system. In this example, we model a CE 152 Magnetic Levitation system where the controller is used to position a freely levitating ball in a magnetic field. The control structure for this model is fixed and the required controller performance can be specified in terms of an idealized time response.
Earnshaw's Theorem
Earnshaw's theorem proved that it is not possible to achieve stable levitation using static, macroscopic, classical electromagnetic fields. However the CE 152 system works around this by creating a potential well around the point at which the ball is to be suspended, thereby creating a non-inverse square law force. This is achieved by an inductive coil that generates a time varying electromagnetic field. The electromagnetic field is controlled through the use of feedback to keep the ball at the required location.
open_system('maglev_demo')

Model Description
The magnetic levitation system is a nonlinear dynamic system with one input and one output. Double-click the Magnetic Levitation Plant Model to open this subsystem. The input voltage is applied to a coil that creates the electromagnetic field. The output voltage is measured by an IR receiver and represents the position of the ball in the magnetic field. The diagram below outlines this system.

The physical system consists of a ball (with mass 0.00837 kg) which is under the influence of three forces:
The magnetic field produced by an inductive coil. This is modeled by the
Power amplifier and coilblock in the Simulink® model. The input to the inductor is a voltage signal and the output a current. The force from the coil depends on the square of the current, the air-gap between the coil and the ball, and the physical properties of the ball. This produces an upward acting force on the ball.
The gravitational force acting downwards
A damping force which acts in a direction opposite to the velocity at any instant of time
These three forces cause the resulting motion of the ball and are modeled in Simulink as shown.
open_system('maglev_demo/Magnetic Levitation Plant Model')

Non-linearities arising from saturation of the coil and changes in dynamics outside the limits of the magnetic field are also modeled in the Simulink Model. As the force from the coil decays according to an inverse square law larger voltages are required the further the ball is from the coil. The control signal is scaled to account for this and the scaling is included in the Control signal scaling blocks.
Control Problem Description
The requirement for the controller is that it be able to position the ball at any arbitrary location in the magnetic field and that it move the ball from one position to another. These requirements are captured by placing step response bounds on the position measurement. Specifically we require the following constraints on the ball:
Position constraint: within 20% of the desired position in less than 0.5 second
Settling Time Constraint: within 2% of the desired position within 1.5 second
To meet the control requirements we implement a Proportional-Integral-Derivative (PID) controller. For convenience the controller uses a normalized position measurement with a range from 0 to 1, representing the bottom-most and top-most positions of the ball respectively.
Simulink® Design Optimization™ and numerical optimization is ideally suited to tune the PID coefficients because:
The system dynamics are complex enough to require effort and time for analysis if we approach the problem using conventional control design techniques.
The controller structure is fixed.
We have knowledge of the step response we require from the system.
Setting Constraint Values
Given the step response characteristic we desire, it is simple to specify the upper and lower bounds of the response. Double-click the Position Constraint block in the Magnetic Levitation Plant Model subsystem to view constraints on the position of the ball. The constraint lines may be moved using the mouse.

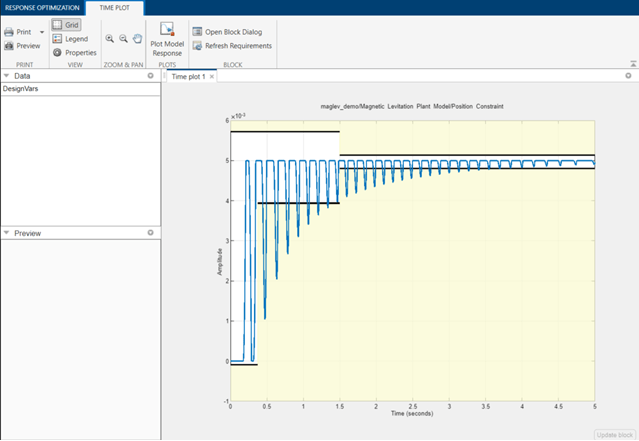
You can launch the Response Optimizer using the Apps menu in the Simulink toolstrip, or the sdotool command in MATLAB®. You can launch a pre-configured optimization task in the Response Optimizer by first opening the model and by double-clicking on the orange block at the bottom of the model. From the Response Optimizer, press the Plot Model Response button to simulate the model and show how well the initial design satisfies the design requirements.

Defining Tuned Parameters
We select the PID controller parameters to tune by opening the Design Variables editor, as shown below.

Running the Optimization
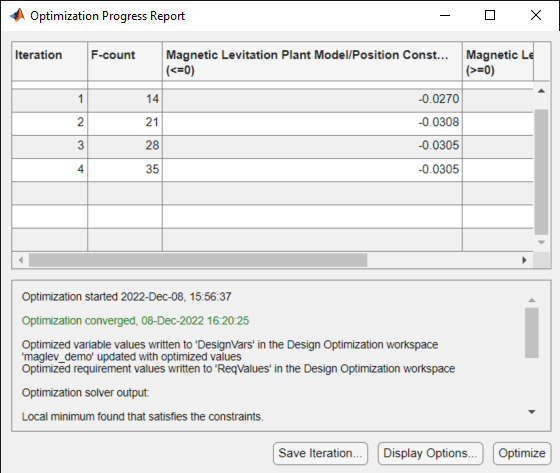
After specifying the optimization parameters and the required step response bounds we start the optimization by pressing the Optimize button from the Response Optimizer. During optimization, the plots are updated with the position of the ball for each iteration and the dark curve shows the final optimized trajectory of the ball (as shown below).


Verifying the Results
Once we complete the optimization, it is important to validate the results against other step sizes. A successful parameter optimization should be able to provide good control for all steps sizes close to the tuned step size of 1. Step sizes from .7 to 1 should be tested to confirm the controller's performance. The following plot shows the response to a step input from 0 to 0.85 at 0.1 seconds.

Conclusion
The verification step shows that controller's performance satisfies the requirements specified and the tuned parameter values are suitable for control. The tuned parameters could be used to provide baseline performance against which other control schemes can be compared, or a baseline for controllers for different operating regions.