Inspect Simulink Desktop Real-Time Signals with Simulation Data Inspector
This example shows how to use the Simulation Data Inspector (SDI) to log signal data from the real-time application. Use Simulink® Run in Kernel mode to establish a communication channel between your Simulink block diagram and your real-time application. Control which signals to display by selecting them in the model. You can log signal data from models referenced at arbitrary levels within a model hierarchy.
This example uses the model sldrtex_model. To open this example, in the MATLAB® Command Window, type:
open_system('sldrtex_model')
Open
sldrtex_model.In the Simulink Editor, on the Simulation tab, set the simulation stop time to, for example,
30seconds.In the model, select the signals
Signal GeneratorandTransfer Fcn.On the Desktop Real-Time tab, click Log Signals. A faint Simulation Data Inspector icon appears next to each signal.
To start the real-time execution in Run in Kernel mode, on the Desktop Real-Time tab, click Run in Real Time. The Simulation Data Inspector button glows, indicating that Simulation Data Inspector has data available for viewing.
On the Desktop Real-Time tab, click Data Inspector.
In the Simulation Data Inspector, select the signals
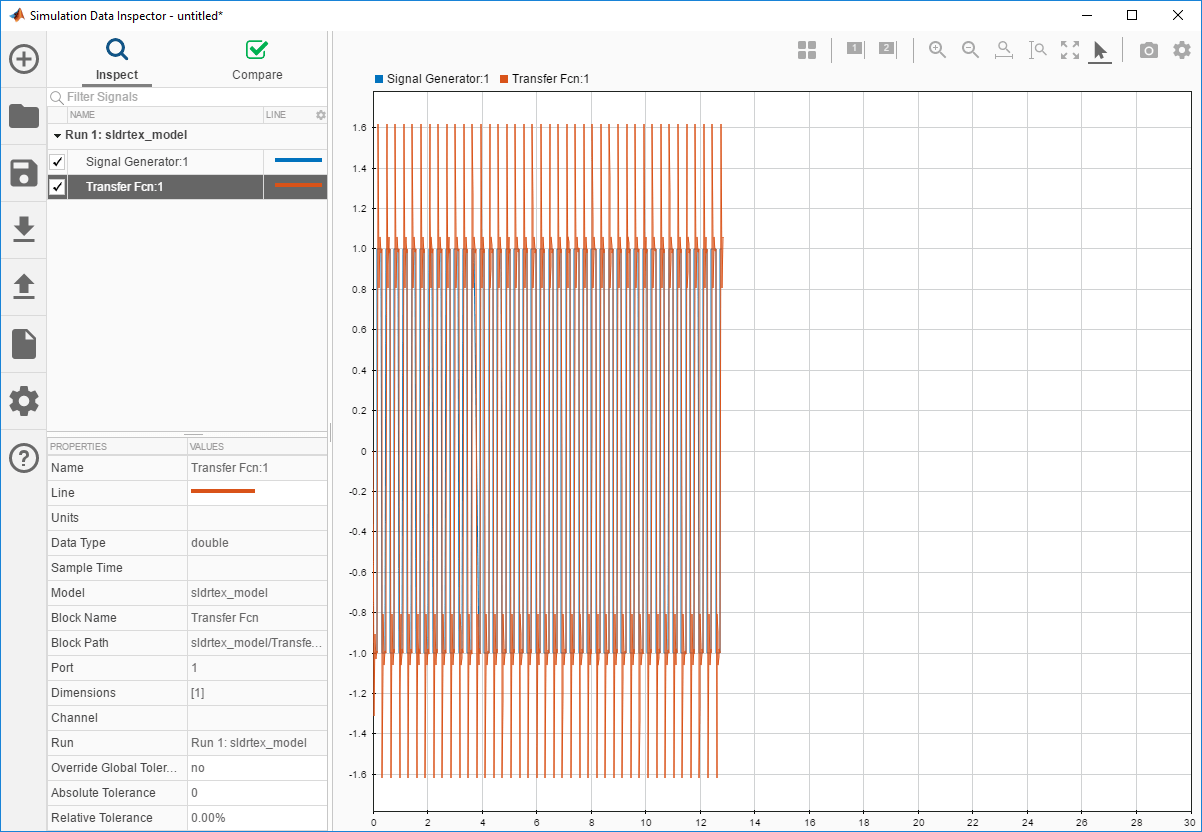
SignalGenerator:1andTransfer Fcn:1. Simulation Data Inspector displays plotted data.

10. To stop the simulation, click the Stop button.
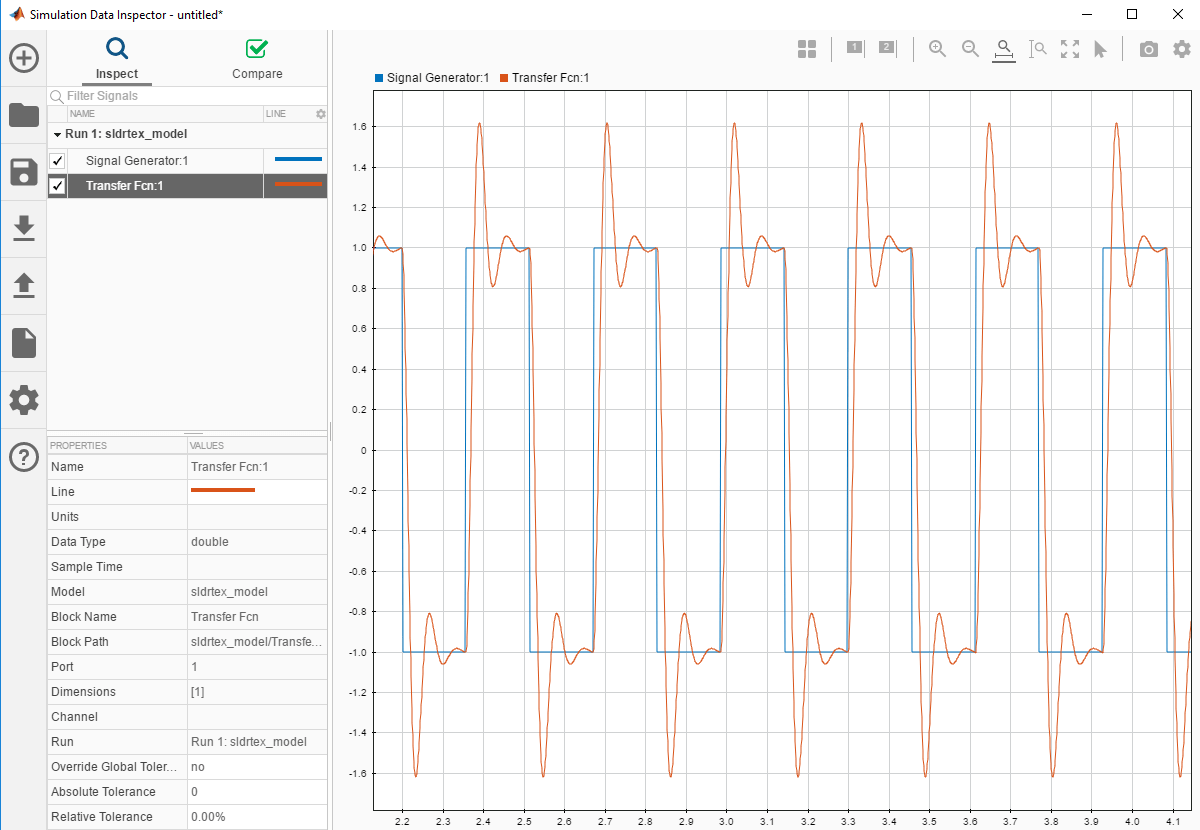
11. After the simulation, use the toolbar buttons to explore the data. For example, to view the simulation between seconds 2 and 4, in Simulation Data Inspector, click the Zoom in Time button. Drag the cursor over the range from 2 to 4.

12. To save the Simulation Data Inspector session as a .mat file, click Save.