Task Execution
This example shows how to simulate task execution and how to generate code and run it on an SoC hardware board.
Application development often includes simulating an algorithm to ensure the correct behavior. Such simulations usually ignore the real-time aspects of an embedded system environment. This may allow certain timing problems to remain undiscovered until the application runs on hardware.
The timing problems often lead to incorrect application behavior. SoC Blockset helps you detect these problems in simulation rather than on hardware. This can help you avoid costly debugging on hardware.
Timing problems are more likely to occur as applications become more complex. For example, rate overruns and undesired rate preemption are more frequent in applications with multiple tasks due to resource constraints and task dependencies. Simulating multitasking applications with SoC Blockset™ helps you in detecting these problems early.
In this example, task execution is simulated using SoC Blockset. You will learn about different techniques for simulating task duration and when to use them. You will also learn how to verify the timing specifications on hardware.
Supported hardware platforms:
Xilinx® Zynq® ZC706 evaluation kit
Xilinx Zynq UltraScale™+ MPSoC ZCU102 Evaluation Kit
ZedBoard™ Zynq-7000 Development Board
Altera® Cyclone® V SoC development kit
Altera Arria® 10 SoC development kit
The models used in this example are set for Xilinx Zynq ZC706 evaluation kit board. To use a different hardware board, select one of the hardware boards listed in the Hardware Board on the System on Chip tab. Do the same for the top model and the referenced model.
Introduction
SoC Blockset simulates the execution of software tasks as they would execute on an SoC processor. The simulation honors the parameters of the task, such as period, priority and processor core. SoC Blockset simulates task preemption, task overruns, and concurrent task execution.
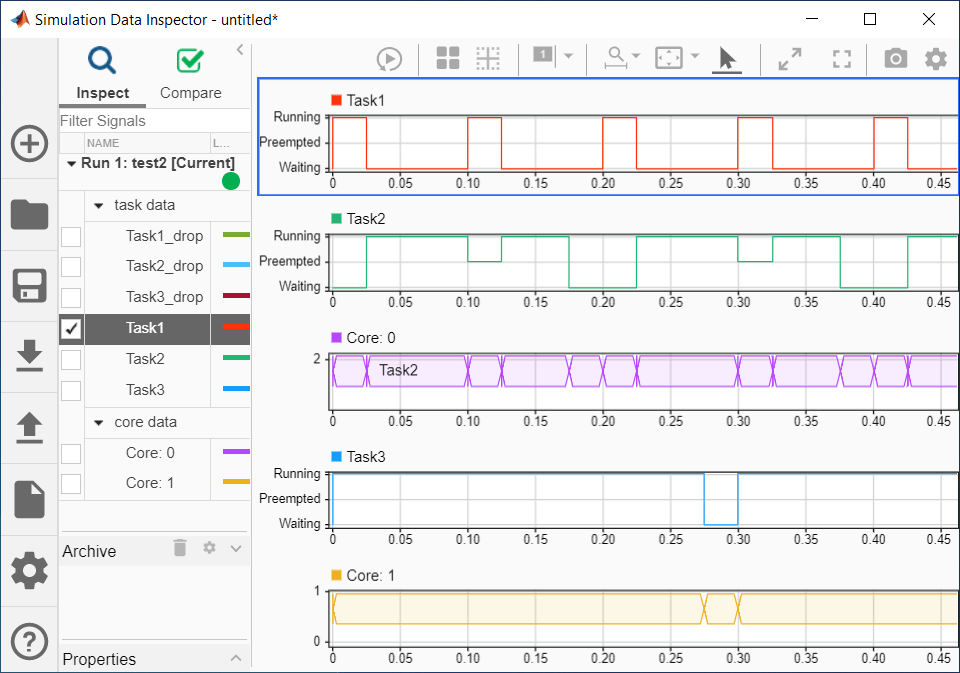
The following diagram illustrates the above-mentioned task execution simulation aspects. In the first two subplots, you can observe that Task1 executes every 0.1 s and, since they both share Core 0, Task1 preempts Task2 that executes every 0.2 s. In the third subplot, you can observe that Core 0 still has some idle time. The last two subplots show Task3 running every 0.3 s on Core 1.
To learn more about simulating task execution, see What is Task Execution?
The Task Manager block allows you to configure execution of the tasks in your model. In the block dialog box, you define how many tasks you need in your system using Add and Delete buttons. On the Main tab of the dialog box, you set the main task properties, while on the Simulation tab you set the simulation task properties.
The following figure illustrates the Main tab of the Task Manager block.

A task has a name so that it can be identified in the model and the various associated plots. Port labels on the Task Manager block use the task names for easy identification.
A task can be of two types. An event-driven task executes when triggered by an event. An event line from an IO data source block connected to the Task Manager block triggers the task. A timer-driven task executes with a defined period as defined in the Main tab of the Task Manager.
You define the priority of event-driven tasks in the Main tab of the Task Manager. Timer-driven task priority is assigned automatically.
In the Task Manager dialog box you may also set the processor core on which to execute a task so that, if your hardware board has multiple cores, you may set the tasks to execute concurrently.
The Task Manager block also allows you to configure how task overruns are handled. For example, you may decide to drop an instance of a task if the previous task instance has not started or completed. Or, you may decide to try to catch up with the task schedule despite overruns.
To simulate real-time task effects, such as preemption and overruns, SoC Blockset requires you to provide the duration of each task. The duration is defined as the time elapsed between the task start and the task end. Ideally, you will measure the task duration on your hardware board. If that is not possible, look up the task duration in the data sheets provided by the task algorithm developers. As a last resort, you should set the duration relative to the task period or the shortest recurrence interval for aperiodic tasks.
SoC Blockset has several choices for setting the task duration. As the task duration is applied only to simulation, these choices are found in the Simulation tab of the Task Manager dialog box.
The following figure illustrates the Simulation tab of the Task Manager dialog box.

The most commonly used options are:
Dialog - Allows you to specify task duration via a normal distribution, or a combination of multiple normal distributions, using the mean and the standard deviation parameters.
Input port - Allows you to specify task duration on an instance basis. For example, you may create a model that calculates task duration and connect it to the Task Manager input port.
The following flow chart will guide you in selecting the most appropriate option.

If the duration times for your task have different distributions and causes, select the most fitting options using the flow chart as general guidance.
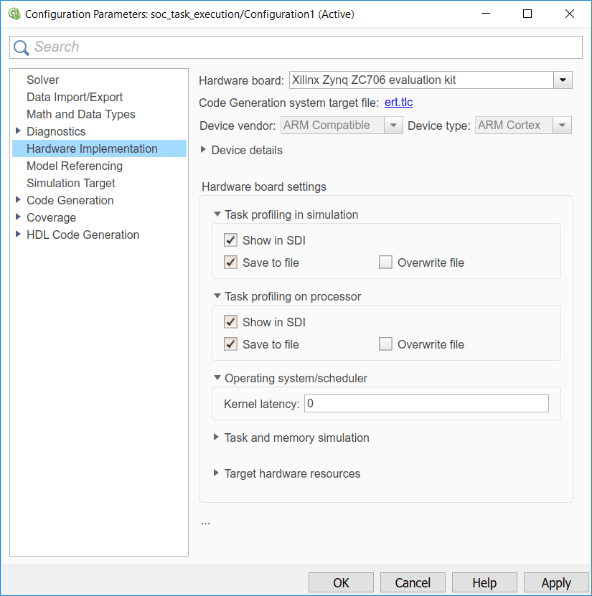
You can configure additional simulation and execution parameters for SoC Blockset in the model configuration dialog box. Task profiling, in simulation and on processor, allows you to profile task execution, stream results to Data Inspector and save them into a file.
You can also set the kernel latency value to affect task execution in simulation. This value varies a lot but is typically much smaller than task duration. Therefore, we recommend you leave the value set to 0 s unless you can deterministically find the appropriate value for your hardware board.
The following figure shows SoC parameters related to task execution in the model configuration parameters dialog box. Note that the Task profiling on processor panel shows only if you install all required products and hardware support packages.
The remaining steps of this example will illustrate some of the options shown in the above flow chart.
Simulating an Algorithm with Single Code Path
This case requires you to simulate a DSP algorithm that processes a frame of data. The following product is required for that:
DSP System Toolbox
If you do not have this product, proceed to the next case after reviewing the description of this case.
In this case, you will learn how to model the task duration when the task algorithm has a single code path.
Assume that you are tasked with developing an application that processes RF (radio frequency) data on an SoC board. After being preprocessed in the FPGA core, the data is streamed to the processor core using the AXI4 protocol. The algorithm running on the processor core should determine whether the data contains a high-frequency or a low-frequency signal. To that end, a low-pass and a high-pass filter are applied to the data. The resulting signals are then compared to a selected threshold. Based on this description, this task has a single code path, with no major code branches. The source code for the task function might have the following form.
double dataReadTask(double in[])
{
    /* Frame size is always 1000 */
    int signalType; /* 0 - LP, 1 - HP */
    double out1[1000], out2[1000];
    filterLP(in, out1, 1000);
    filterHP(in, out2, 1000);
    signalType = thresholding(out1, out2, 1000);
}
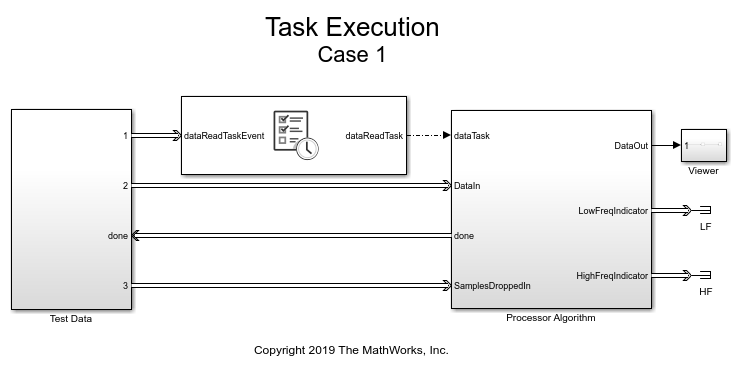
1. Open the model. Note the Test Data subsystem. The RF Data Source block in the subsystem represents the external memory and the FPGA core. The RF Data Source block has two output ports, Stream Data and event. They output the RF data and a notification when new data frame is available, respectively.
2. Note that the RF Data Source block generates frames of 1000 samples every 0.01 s. The frames are samples of a 1 kHz sine waveform.
3. Click the Task Manager block. Observe that it sets an event-driven task dataReadTask. The task is triggered by the arrival of a new data frame.
4. Click the Simulation tab in the Task Manager dialog box to define the task duration for simulation.
Since the algorithm consists of two filters executing without conditions, the application has a single code path. Therefore, you follow the first left branch in the flow chart shown in the introduction and you expect that the algorithm execution times have a normal distribution.
Based on the information given by the algorithm developer, you determine that the mean execution time is 0.0095 s and that the standard deviation is 0.0001 s. To represent the real-time limits, you also decide to set the min and the max execution times to 0.00925 s and 0.00975 s, respectively.
Set the duration parameters in the Task Manager dialog box in the Simulation tab as described above.
5. In the model, click Run to start the simulation. Wait until the simulation completes.
6. From the model toolbar, open the Data Inspector and inspect the dataReadTask. Zoom in to inspect the task execution times more closely.

7. Run the following command to perform the statistical analysis of the task execution times. Observe the Data Inspector run numbers. Modify the command if your run numbers are different.
socTaskTimes('soc_task_execution', 'Run 1: soc_task_execution')
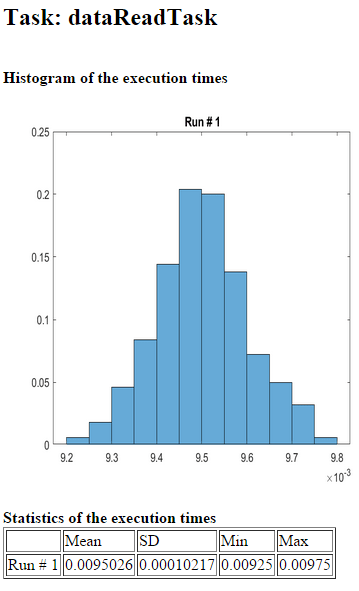
Observe that the task durations vary. As expected, the histogram of the task duration times indicates that the algorithm has one code path. The duration values are clustered around the mean value of 0.0095 s.
8. Close the model without making any changes.
Simulating an Algorithm with Two Code Paths
In this case, you will learn how to model the task duration when the task algorithm has two code paths and it can be predicted which path will be taken.
Assume that you are developing a video surveillance application. The task is to constantly process video data to determine if there was intrusion in the system. The algorithm calculates the amount of scene change between consecutive video data frames. If the scene change exceeds the selected threshold, such frames are recorded as they may be used as evidence of potential intrusion. Thus, this algorithm has two code paths. The source code of this algorithm may be represented in the following form.
void VideoTask(single in[], in length, double threshold)
{
    double energy;
    energy = calcSceneChange(in, length);
    if (energy > threshold)
        recordFrame(in, length);
    }
}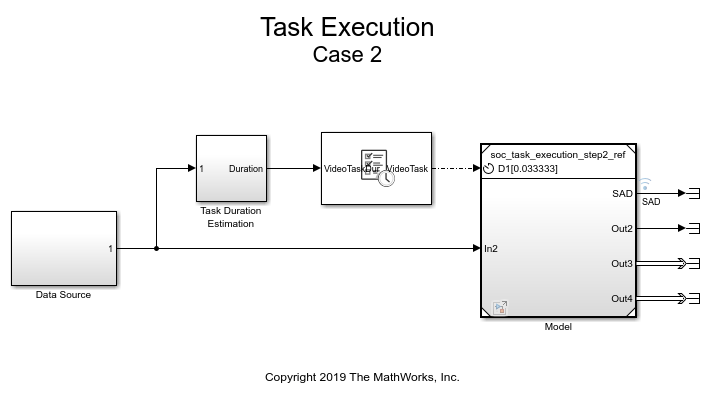
1. Open the model. Note the Data Source block that outputs the frames of video data.
2. Click the Model block and observe that the algorithm calculates motion energy between consecutive frames of data. If the calculated motion energy exceeds the threshold, the Main Algorithm is executed.
3. Click the Task Manager block. Observe that it sets a timer-driven task VideoTask. This task runs every 0.33333 s, which is the video frame rate.
4. Click the Simulation tab in Task Manager dialog box to define the task duration for simulation.
Since the algorithm has two code paths and it can be predicted which code path will be taken, follow the second left branch in the flow chart.
Model task duration to depend on motion energy. Depending on whether the motion energy threshold is exceeded or not, you will assign the task duration with the mean of 75% or 50% of the frame rate, respectively.
Click the Task Duration Estimation subsystem to understand how to model task duration.
5. In the model, click Run to start the simulation. Wait until the simulation completes.
6. From the model toolbar, open the Data Inspector and inspect VideoTask. Zoom in to inspect the task execution times more closely.
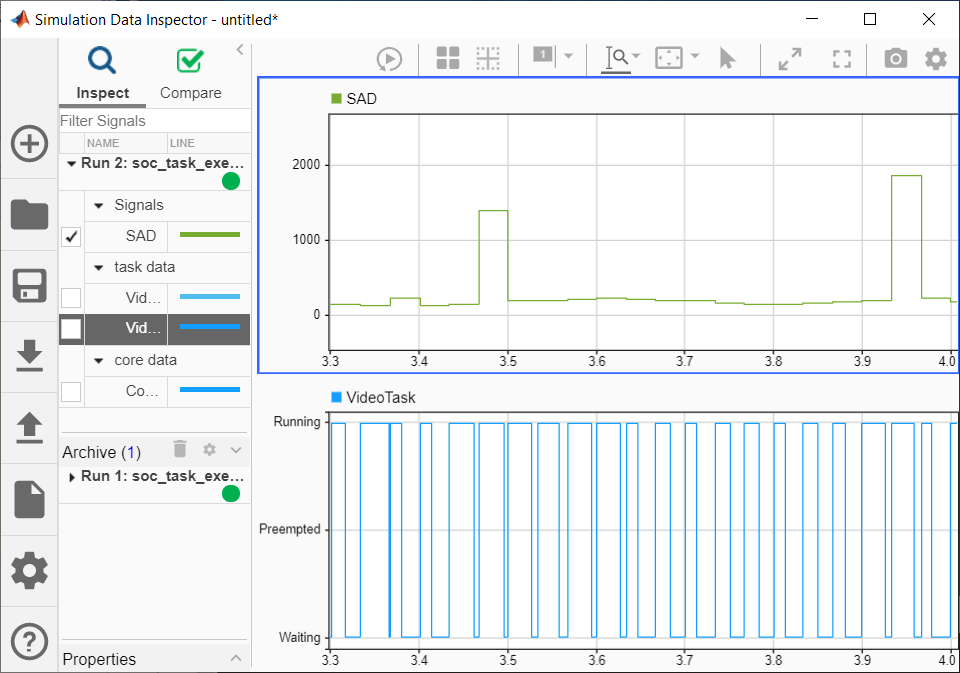
7. Run the following command to perform the statistical analysis of the task execution times. Observe the Data Inspector run numbers. Modify the command if your run numbers are different.
socTaskTimes('soc_task_execution_step2', 'Run 2: soc_task_execution_step2')
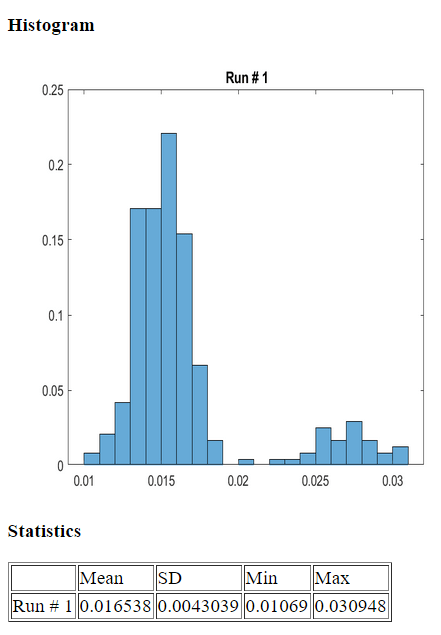
Observe that the task durations vary. As expected, the histogram of the task duration times indicates that the algorithm has two code paths.
8. Close the model without making any changes.
Simulating an Algorithm with Indeterminate Number of Code Paths
In this case, you will learn how to model the task duration when the task algorithm has an indeterminate number of code paths, but the code paths are repeatable for the given set of data.
In this case, assume that you are developing a complex application that processes data on an SoC board. Due to the complexity of the processing, the algorithm has an indeterminate number of code paths. As a result, it is not possible to predict which code path will be taken. However, it is known that the distribution of task durations is repeatable in multiple experiments. The source code for such an algorithm might have the following form.
int myTask(int arr[], int length)
{
    int i = 0;
    int sum = 0;
    while (i < length) {
        if (arr[i] > 0)
            sum = sum + arr[i]
        i++;
    }
}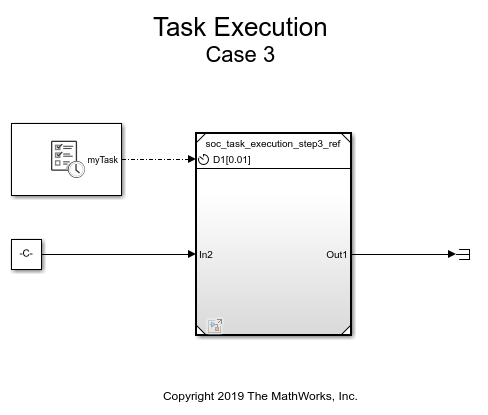
1. Open the model.
2. Click the Task Manager block and select the task myTask. Click the Simulation tab. Observe that we define the probability distribution as a combination of two normal distributions.
3. Click Run to start the simulation. The task execution data will be streamed to the Data Inspector.
4. Run the following command to perform the statistical analysis of the task execution times obtained in simulation. Observe the Data Inspector run number. Modify the command if your run number is different.
socTaskTimes('soc_task_execution_step3', 'Run 3: soc_task_execution_step3')
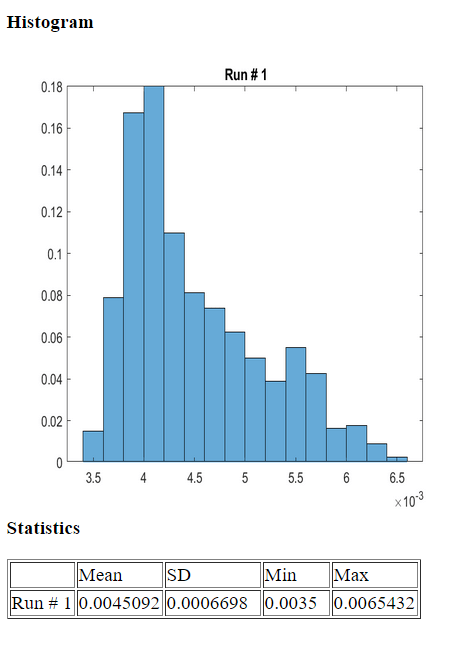
Notice that the task duration distribution obtained in simulation matches the expected results.
5. Close this model without making any changes.
Simulating an Application using Proxy Tasks
Assume that you are developing a complex application that adds one more task to the model developed in the previous case. The implementation of this task is not currently available, but the timing specification for this task is known. The task executes every 0.02 s with the duration described by a normal distribution. The distribution has a mean of 0.008 s and standard deviation of 0.0009 s.

1. Open the model.
2. Click the Task Manager block and select the task proxyTask. Click the Simulation tab. Observe that we define the probability distribution as a normal distribution with the parameters mentioned in the introduction of this task.
3. Inside the Model block open the Proxy Task block and inspect the sample time value. The sample time value must match the period value entered in the Task Manager block. Click Cancel.
4. Click Run to start the simulation. The task execution data will be streamed to the Data Inspector.
5. Run the following command to perform the statistical analysis of the task execution times obtained in simulation. Observe the Data Inspector run number. Modify the command if your run number is different.
socTaskTimes('soc_task_execution_step4', 'Run 4: soc_task_execution_step4')
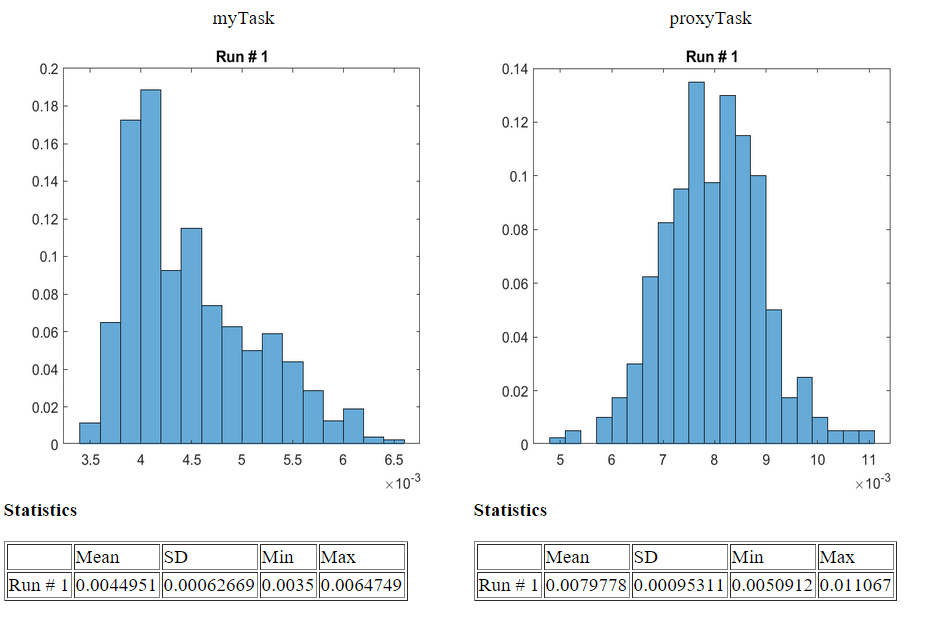
Notice that the task durations obtained in simulation for both application and the proxy tasks.
6. Close this model without making any changes.
Compare the Simulation Results with the Results on Hardware
In this section, you will compare the timing results obtained in the previous simulation to the timing results obtained on your hardware board.
Required products:
Embedded Coder®
SoC Blockset Support Package for AMD® FPGA and SoC Devices, or
SoC Blockset Support Package for Intel® Devices
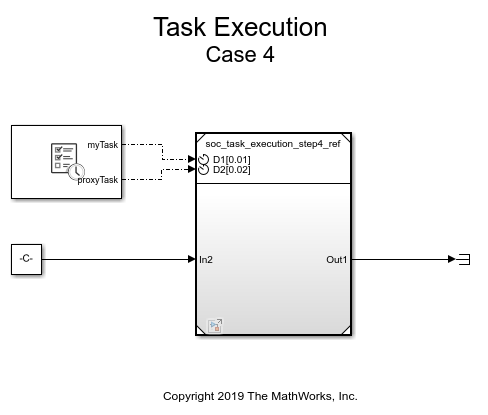
1. On the System on Chip tab, click Configure, Build & Deploy.
2. Follow the SoC Builder workflow until you get to the Select Build Action screen.
3. Select Build and load for external mode and continue until you complete the workflow.
4. Click on Monitor & Tune to deploy the model to the hardware. The model is already set to profile task execution as it runs on hardware and stream the profiling data to Data Inspector in real-time.
5. Run the following command to perform the statistical analysis of the task execution times obtained on hardware. Observe the Data Inspector run number. Modify the command if your run number is different.
socTaskTimes('soc_task_execution_step4', 'Run 5: soc_task_execution_step4')Notice that the task durations obtained on hardware match the results obtained in simulation.
6. Close this model without making any changes.
Summary
This example showed you how to simulate task execution in a multitasking operating system, how to generate code and run it on a hardware board, and how to collect the real-time task execution data.
In this example, we used simple applications, each with one task. In a typical application, however, multiple tasks must be performed. Embedded applications must run each task per defined schedule. To allow for using the processor most efficiently and to react quickly to external events, a priority-based preemptive scheduling algorithm is used.
With priority-based preemptive scheduling, when a task gets preempted, a task switch occurs. The data used by the task (task context) is saved so that it can be restored when the task resumes executing. In this example, the task switching times are dwarfed by the task duration and are not simulated. In applications with much shorter task duration, you may need to consider them.
If a hardware board has multiple processor cores, embedded applications typically attempt to use all cores for the most efficient implementation. SoC Blockset uses a priority-based preemptive scheduling algorithm even when the processor has multiple cores. SoC Blockset honors assignment of tasks per core in both simulation and generated code.
Next, we recommend completing Streaming Data from Hardware to Software example that illustrates a systematic approach to designing a complex SoC application using SoC Blockset.