Task Visualization in Simulation Data Inspector
The Simulation Data Inspector display provides a direct view into the execution timing, the task state, and the execution of tasks in simulation and profiled from generated code running on hardware. Each model run, in simulation or on hardware using external mode adds task execution timing and data to the current Run. This image shows the Simulation Data Inspector display with a Run captured from an SoC Blockset™ model.
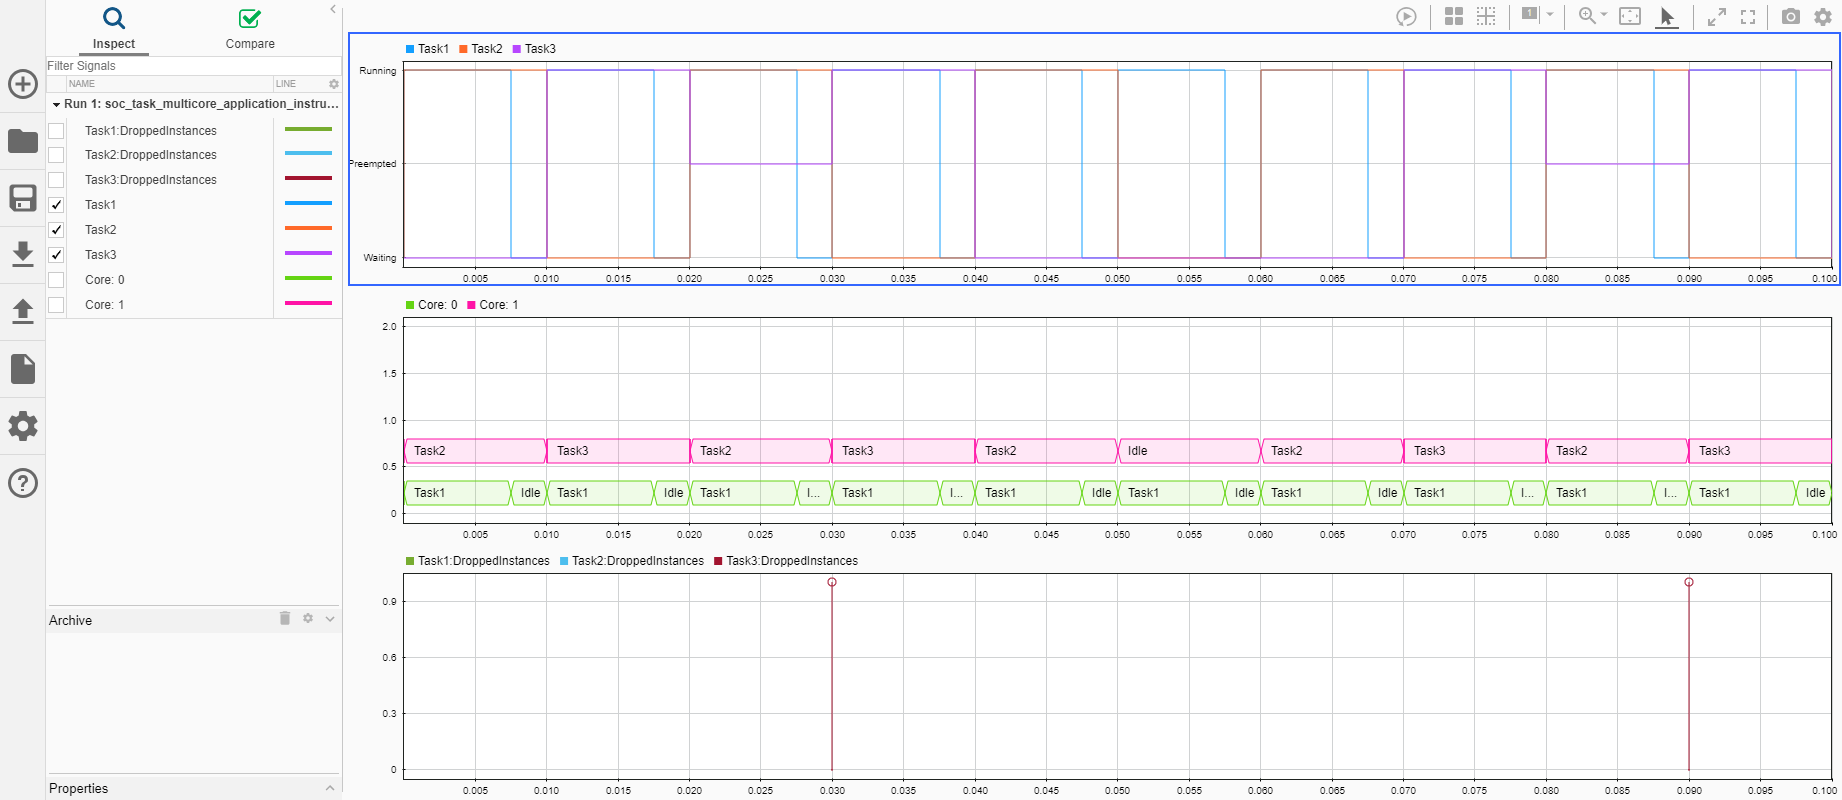
Each Run contains these task related signal types:
tasknametasknameNote
If a task instance does not run to completion during the simulation time, the final task execution instance does not render in the Simulation Data Inspector display.
taskname_droptaskname_dropCore:– Execution activity on corennNote
If a task instance does not run to completion during the simulation time, the related core status over that instance does not render in the Simulation Data Inspector display.
See Also
Simulation Data Inspector | Task Manager