Use Events in Stateflow Charts
In Stateflow®, events control when the states in a chart execute and how transitions occur. By using events, you can create state machines that react to triggers from in the chart or from external sources, such as Simulink® or MATLAB functions. For more information, see Synchronize Model Components by Using Events.
Types of Events in Stateflow
Stateflow events include:
Input events come from outside the chart, such as from Simulink blocks.
Output events communicate with external systems.
Local events communicate within the chart.
Implicit events occur automatically based on state or data changes. See Control Chart Behavior by Using Implicit Events.
Trigger Transitions with Events
You can use events to trigger transitions between states. When an event occurs, the
chart evaluates all transitions that list the event as a trigger. In this example, the event
TempCheck triggers each condition.
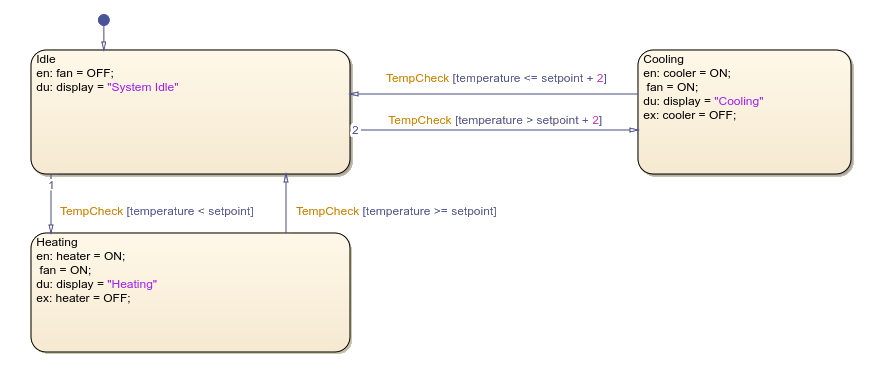
The TempCheck event broadcasts periodically to check for differences
in the temperature data. When the system is in the
Idle state, and the TempCheck event occurs:
If
temperature < setpoint, the transition toHeatingoccurs.If
temperature > setpoint+2, the transition toCoolingoccurs.If neither condition is true, the system remains in
Idle.
When the system is in the Heating state, and the
TempCheck event occurs:
If
temperature >= setpoint, the transition back toIdleoccurs.Otherwise, the system remains in the
Heatingstate.
When the system is in the Cooling state, and the
TempCheck event occurs:
If
temperature <= setpoint+1, the transition back toIdleoccurs.Otherwise, the system remains in the
Coolingstate.
The event-triggered transitions allow the thermostat to remain in its current state until the state checks the conditions, which is more efficient than constantly evaluating temperatures.
Broadcast Events
You can broadcast events from within a chart by using the send
function. When you broadcast an event, the chart immediately processes all transitions and
state actions that respond to that event before continuing.
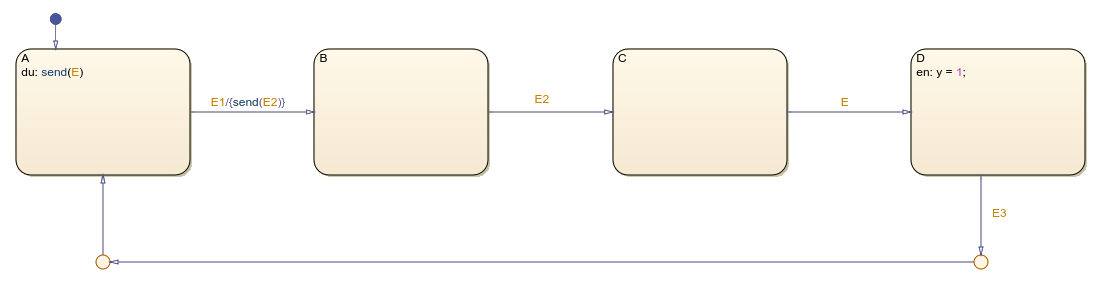
In this example, the state A is the default state. While state
A is active, it broadcasts event E. The event
E causes the state to immediately transition to state
D.
Use Events in State Actions
You can also use events to trigger state actions by using the on
action.

In this example, when state A is active and the chart receives the
event E, x = x + 1. However, when state
B is active and the chart receives the event E,
x = x + 3.
Implicit Events
Implicit events are built-in events that occur during chart execution when:
The chart wakes up.
The chart enters a state and the state becomes active.
The chart exits a state and the state becomes inactive.
The chart assigns a value to an internal data object.
These events are implicit because you do not define or trigger them explicitly. Implicit events are children of the chart in which they occur and are visible only in the parent chart. For more information, see Control Chart Behavior by Using Implicit Events
Bind Events to States
You can use the bind action to connect data and events to a state.
When you bind an event to a state, only that state or its child states can broadcast the
event. When you bind a function-call event to a state, the corresponding function-call
subsystem automatically enables when that state becomes active and disables when the state
becomes inactive. When you implement this type of binding action, the function-call
subsystem only runs when its controlling state is active. For more information, see Control Function-Call Subsystems.
Synchronize Parallel States
You can use events to synchronize activities across parallel states. For example, you can design a chart where:
One state broadcasts an event.
Other states respond to the event through transitions or on actions.
The chart processes all responses before continuing execution.