Create Data-Driven Events
To create data-driven events in Stateflow charts, use the change operator. When you change values in a chart, the chart generates internal
signals, called implicit events, that cause the chart to transition between states or execute
actions. Use the change operator to create state actions and transitions that react to these
implicit events. For more information, see Control Chart Behavior by Using Implicit Events.
You can use the change operator to:
Monitor sensor readings and trigger transitions when values cross thresholds.
Create state machines that respond to signal values without using explicit event broadcasting.
Synchronize parallel states based on shared data changes.
Implement debouncing logic for noisy input signals.
When you use the change operator in transition conditions, the
transition occurs when the specified data changes value.
When you use the change operator in on actions, the
action executes when the chart detects a change in the specified data value.
To reference data in other states, use dot notation with the change
operator. When multiple states or data objects share names, using dot notation prevents
ambiguity.
Monitor a System by Using the change Operator
This example models a temperature monitoring system that uses the
change operator in the state transitions. The system monitors the
temperature and activates cooling when the temperature goes above the threshold. The
parallel states, MonitoringSystem and CoolingSystem,
handle monitoring and cooling functions separately but communicate through the
coolingStatus data.
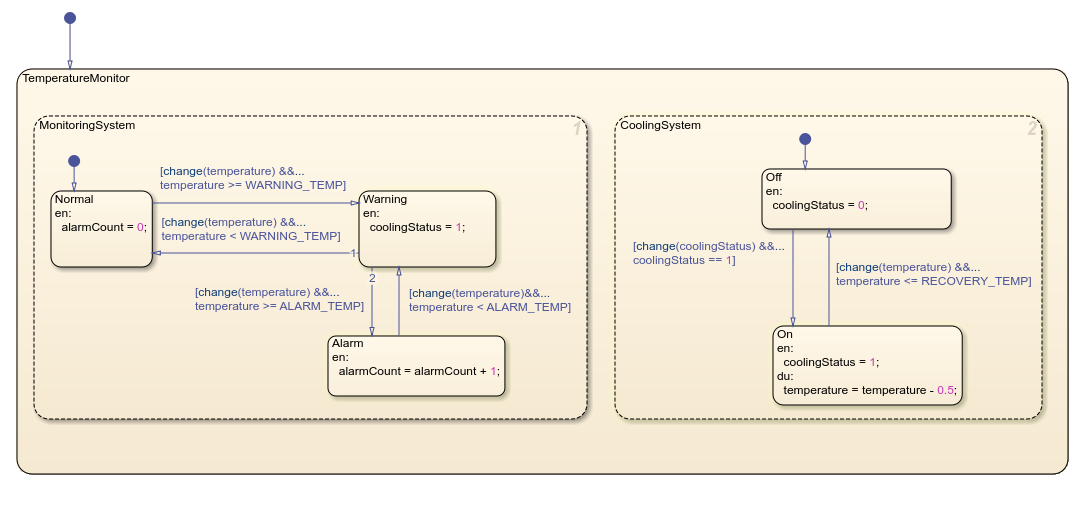
The MonitoringSystem starts in the Normal state
and sets alarmCount to zero. The CoolingSystem state
begins in the Off state and sets coolingStatus
zero.
As the temperature rises and reaches WARNING_TEMP, the
MonitoringSystem state transitions from the
Normalstate to the Warning state due to changes with
the temperature variable. This transition executes the entry action for
Warning, which sets coolingStatus to
1.
The CoolingSystem state detects this change in
coolingStatus and transitions from the Offstate to
the On state. Once in the On state, the
CoolingSystem executes its during action and decreases temperature by
0.5°C in each execution cycle.
When the temperature drops below WARNING_TEMP, the
MonitoringSystem transitions back to the Normal
state, but the CoolingSystem state remains in the On
state until the temperature reaches RECOVERY_TEMP.
If the temperature continues to rise and reaches ALARM_TEMP, the
MonitoringSystem state transitions from Warning to
Alarm, and increments the alarmCount. The chart
maintains this synchronized behavior by using the change operator to
coordinate the parallel states.
Limitations
To avoid unexpected behavior:
Do not use the
changeoperator with output data.Use the
changeoperator only with scalar variables, matrices, or structures.Make sure that all instances of the
changeoperator reference unique and valid data names.