Create Hierarchical State Structures
You can use hierarchical state structures to organize states in a parent-child configuration where child states inherit behavior from their parent states. Use state hierarchy to:
Hide complexity by encapsulating details within parent states.
Create patterns that can be reused across parts of your state machine.
Organize states together to make diagrams easier to understand.
Modify behavior at one level of a chart without affecting other levels.
Inheritance in Hierarchical States
Child states in a hierarchical pattern inherit the behaviors of their parent states. This means that:
Events that trigger transitions on a parent state apply to child states.
Parent state transitions override child state transitions.
Child states inherit the during actions of their parent states.
Create Hierarchical States
When you create a hierarchical state structure:
The parent states become containers for the child states.
The child states inherit behavior from the parent states.
Transitions occur between states at the same levels of the hierarchy.
To create a hierarchical state structure:
Add a state to your Stateflow® canvas. This is the parent state.
Place a second state inside the parent state. This is the child state.
If you have multiple child states, define transitions between the child states.
Add default transitions to specify which child state is active when the parent becomes active.
Use State Decomposition
Charts can use either parallel or exclusive state decomposition. Exclusive state decomposition, also known as OR decomposition, means that only one child state can be active at a time in a parent state. For more information about state decomposition, see Define Exclusive and Parallel Modes by Using State Decomposition.
When using exclusive state decomposition:
When a parent state becomes active, one of its child states becomes active.
Transitions between child states deactivate the source state and activate the destination state.
Child states can have their own child states.
This example shows how exclusive (OR) decomposition organizes system behavior into a structure.
This chart models a temperature control system that has three modes of operation. In the
Off state, the system is off. In the Heating state,
the system warms the environment. In the Cooling state, the system cools
the environment.
Both the Heating and Cooling states have three
intensity levels:
Low: This state uses the least amount of power to heat or cool. This setting changes the temperature slowly.Medium: This state uses an average amount of power to heat or cool. This state balances power and performance.High: This state uses the most power to heat or cool. This state changes the temperature quickly.
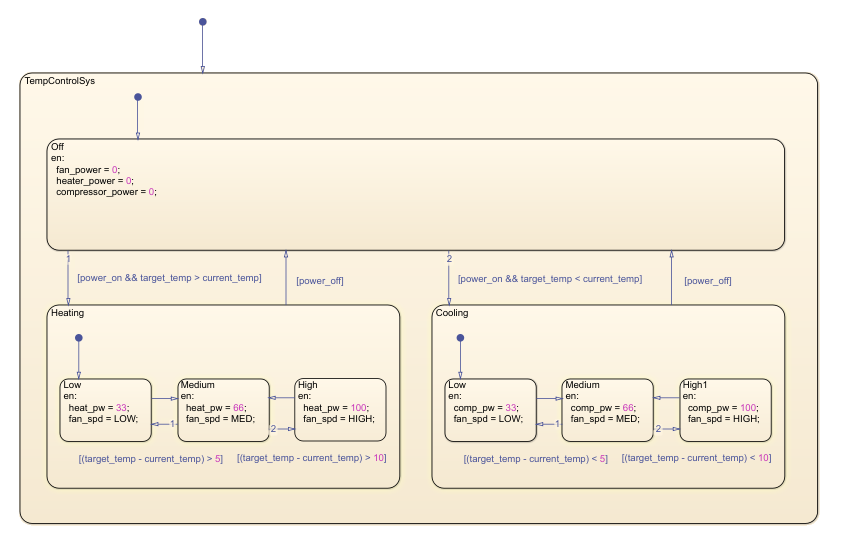
This chart uses two levels of hierarchy. Since the chart uses exclusive state decomposition at each level, one operational mode can be active at the top level, and one intensity level can be active in each operational mode.
The system transitions between states based on temperature conditions and user input.
The Off to Heating transition occurs when
power_on && target_temp > current_temp. The
Off to Cooling transition occurs when
power_on && target_temp < current_temp.
Intensity transitions occur based on the temperature differential. Larger temperature differences trigger transitions to higher intensity levels. As the temperature approaches the target, the system steps down to lower intensity levels.
Each state contains entry actions that define its behavior. In the
Off state, entry actions power down components. In the
Low, Medium, and High states,
entry actions set component power levels and fan speeds.
Best Practices
To aid with chart readability, limit hierarchy depth to 3-4 levels.
Consider using states when behaviors must execute at the time.