Implement Stateflow Data
To control the flow of data through your Stateflow chart, use inputs, outputs, or local data. Data objects can also store values for chart calculations. Stateflow® charts use data to receive input values, perform calculations, and send output values to Simulink® models. Data objects define the variables that your chart can access during simulation.
How to Use Data in Stateflow Charts
Data moves between your Stateflow chart and the Simulink model through defined interfaces. Input data receives values from Simulink input signals. Output data sends values to Simulink output signals. Local data stores values within the chart for internal calculations. Parameter data provides constant values from the MATLAB® workspace.
Input data objects receive values from Simulink blocks connected to the input ports of your chart. Use input data when:
Your chart needs real-time sensor readings.
Simulink blocks provide command signals to your chart.
External systems send data to your chart.
Output data objects send calculated values from your chart to Simulink blocks through output ports. Use output data when:
Your chart generates control signals for actuators.
You need to send status flags to other blocks.
Your chart calculates values that other parts of your model require.
Local data objects store intermediate values and state information in your chart. Use local data when:
Your chart needs to track counter values or timers.
You store filtered or processed sensor values.
State transitions depend on accumulated data.
Parameter data objects provide constant values from MATLAB workspace variables or data dictionaries. Use parameter data when:
You need configurable threshold values.
System constants must be shared across multiple charts.
You want to tune chart behavior without modifying the chart structure.
Data Properties
Each data object has properties that determine its behavior:
Name: Identifier used in chart actions and conditions
Scope: How the data operates in your chart (Input, Output, Local, Parameter)
Size: Number of elements (scalar, vector, or matrix)
Type: Value format (double, boolean, integer, etc.)
Initial Value: Starting value for local and output data
This chart models a temperature control system. The chart receives temperature readings, compares them to the setpoint and outputs heating commands while respecting safety limits.
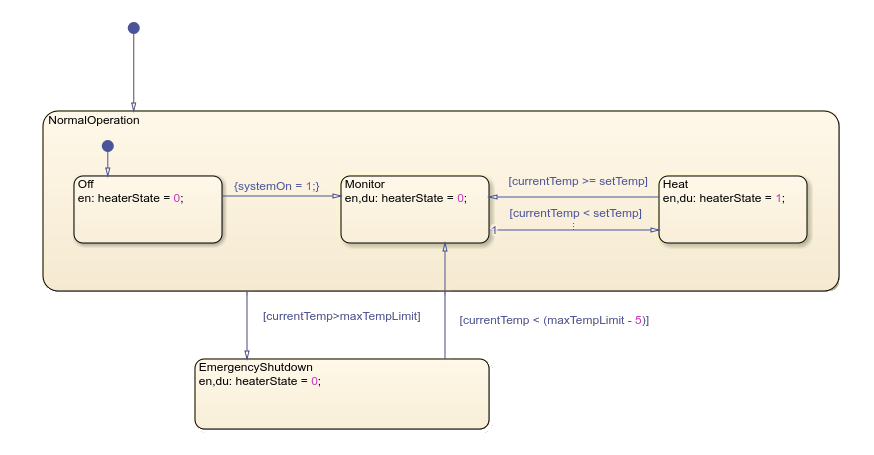
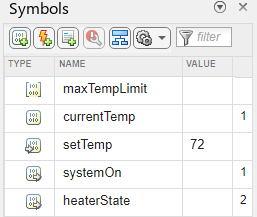
In this chart, maxTempLimit is a parameter,
currentTemp is a local data, setTemp is an input, and
systemOn and heaterState are both outputs.
You can add and manage data objects in your chart by using the Symbols pane.
For more information, see Add Stateflow Data.