Teach How to Model Battery Management System
R2026bThis example shows a battery management system (BMS) that monitors and controls a battery to keep it operating safely. The BMS reads sensor data and responds to changing conditions by opening or closing contactors, detecting faults, and balancing cell voltages. Stateflow implements this logic as a reactive, event-driven state machine. Each operating mode of the battery corresponds to a state, and transitions between states occur when measured conditions meet defined thresholds. Electric vehicles, industrial equipment, and energy storage systems use BMS systems.
After working through this material, students will be able to explain Coulomb counting for SOC estimation, describe passive cell balancing, calculate precharge circuit behavior, and interpret BMS state transitions in a Stateflow chart.
Battery Management System
A battery pack consists of multiple electrochemical cells connected in series and in parallel. The total pack voltage is the sum of the individual cell voltages, and pack capacity depends on the number of cells in parallel.
A BMS protects the pack by keeping each cell within its safe operating area by monitoring cell voltage, cell temperature, and pack current against defined thresholds. Exceeding any of these limits degrades cell chemistry and reduces pack lifetime. At extreme values, cells generate heat faster than they dissipate it and risk fire or rupture.
To accomplish this, a BMS performs three core functions:
Estimating battery state
Protecting the battery from unsafe conditions
Optimizing available capacity through cell balancing
The following sections describe each of these functions, beginning with state estimation.
State of Charge
Unlike with a fuel tank, you cannot directly measure the charge remaining in a battery. Voltage alone is unreliable because it varies with load, temperature, and cell aging. Instead, the BMS estimates SOC using indirect methods.
State of charge (SOC) expresses the remaining energy in the battery as a percentage of full capacity. One method for estimating SOC is Coulomb counting, which integrates current over time.
In this equation, is the nominal capacity of the battery in ampere-hours and I is the pack current, with discharge current defined as positive. The capacity varies with temperature, so the subsystem uses a temperature-dependent lookup table to scale the integration.
Coulomb counting accumulates error over time due to sensor drift and uncertain initial conditions. In practice, the BMS periodically recalibrates SOC using voltage-based corrections.
Cell Balancing
Cells age and self-discharge at different rates. Over time, the voltage across cells diverges. A pack with unbalanced cells reaches the cutoff voltage of its weakest cell before the stronger cells are fully discharged. Cell balancing redistributes charge to equalize cell voltages and recover usable capacity.
This model uses passive resistive balancing. Each cell has a parallel bleed resistor and switch. When the switch closes, bleed current bypasses the cell and dissipates excess charge through the resistor. This design reduces the voltage of higher-charged cells to match the lower ones.
The voltage imbalance across the pack is represented by , where . In this equation, and are the highest and lowest cell voltages.
For example, if four cells have voltages , , , and , the imbalance is . With a bleed current and cell capacity, balancing the highest cell down by requires approximately .
Precharge and Inrush Current
When a battery connects directly to a discharged capacitive load, use the following equation to calculate the inrush current.
In this equation, is the battery terminal voltage, is the voltage across the capacitive load, and is the internal resistance of the circuit. For a large voltage difference and low internal resistance, the inrush current exceeds component ratings. A precharge circuit inserts a large resistor in series with the battery before the main contactor closes. The resistor limits current while the load voltage rises exponentially toward the battery voltage. To calculate , use this equation.
In this equation, is the precharge resistance and is the load capacitance.
For example, for a 400 V battery, 200 µF load capacitance, and 10 mΩ internal resistance, the peak inrush current is , which is destructive. This example illustrates why the precharge circuit is essential.
State Machines and Battery Control
The BMS must continuously decide which operating mode is appropriate based on sensor readings. This problem is a discrete decision-making problem, so it is well-suited to a state machine.
A state machine models a system that exists in exactly one state at a time. The system transitions from one state to another in response to inputs. In a BMS, the battery operates in one of four discrete states: standby, charging, discharging, or fault. The battery transitions between each state based on sensor readings and operator requests.
Stateflow charts represent these states and transitions graphically. Each state holds actions that execute when the state transitions to entry, during, or exit. Transitions also carry conditions and actions that execute when the transition becomes active.
Parallel states model situations where multiple independent processes run simultaneously. The FaultDetection chart monitors four independent fault conditions at the same time by using four parallel states. Each parallel state runs its own logic independently and outputs a fault signal when it detects an anomalous condition.
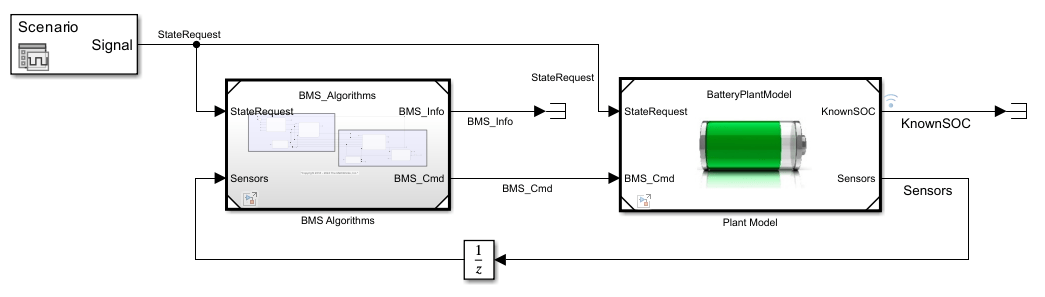
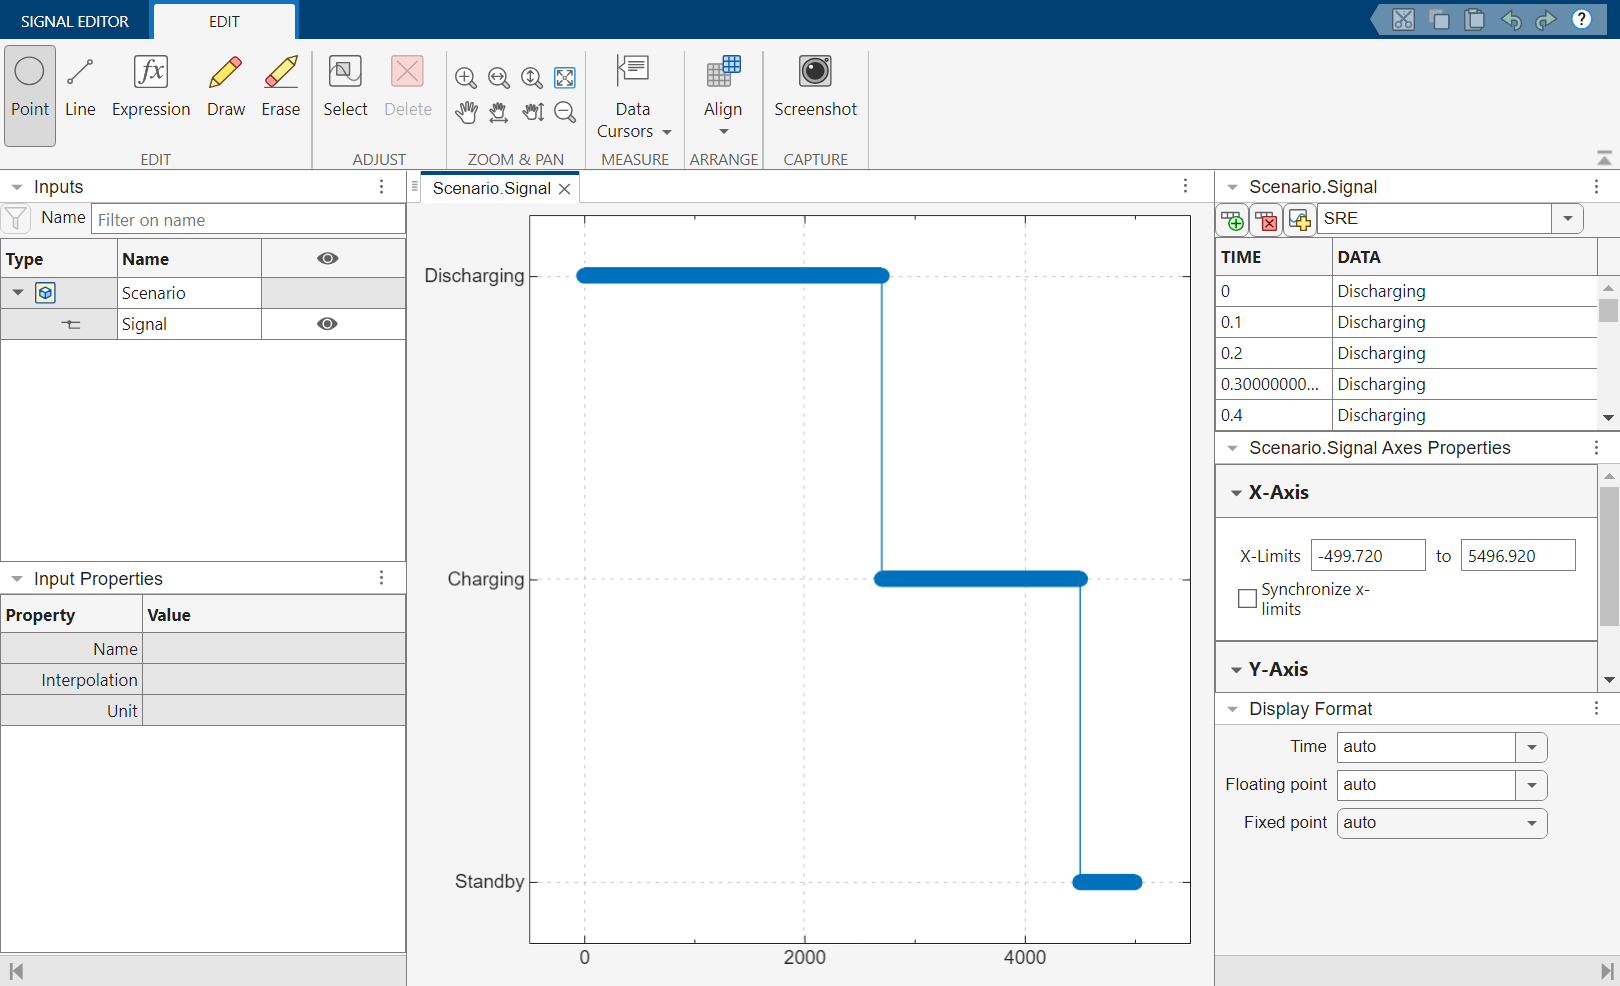
This model contains two top-level subsystems, BMS_Algorithms and Plant Model. BMS_Algorithms implements the control logic. Plant Model simulates the physical battery. The Signal Editor block supplies three test scenarios for different simulations: discharging, charging, and standby.
Power System Control
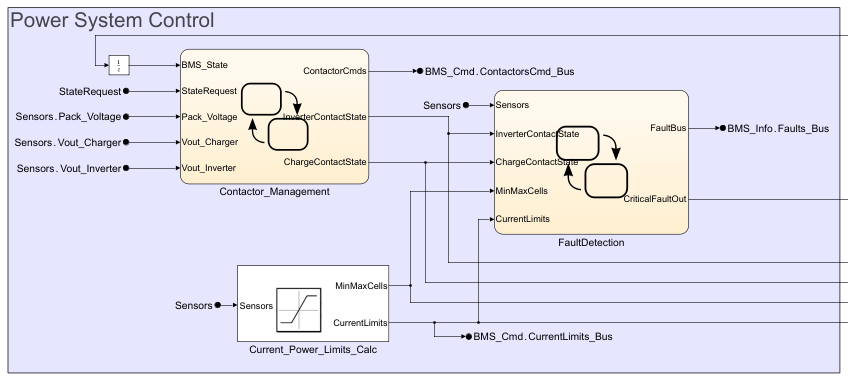
The Power System Control area contains two Stateflow charts, Contactor_Management and FaultDetection.
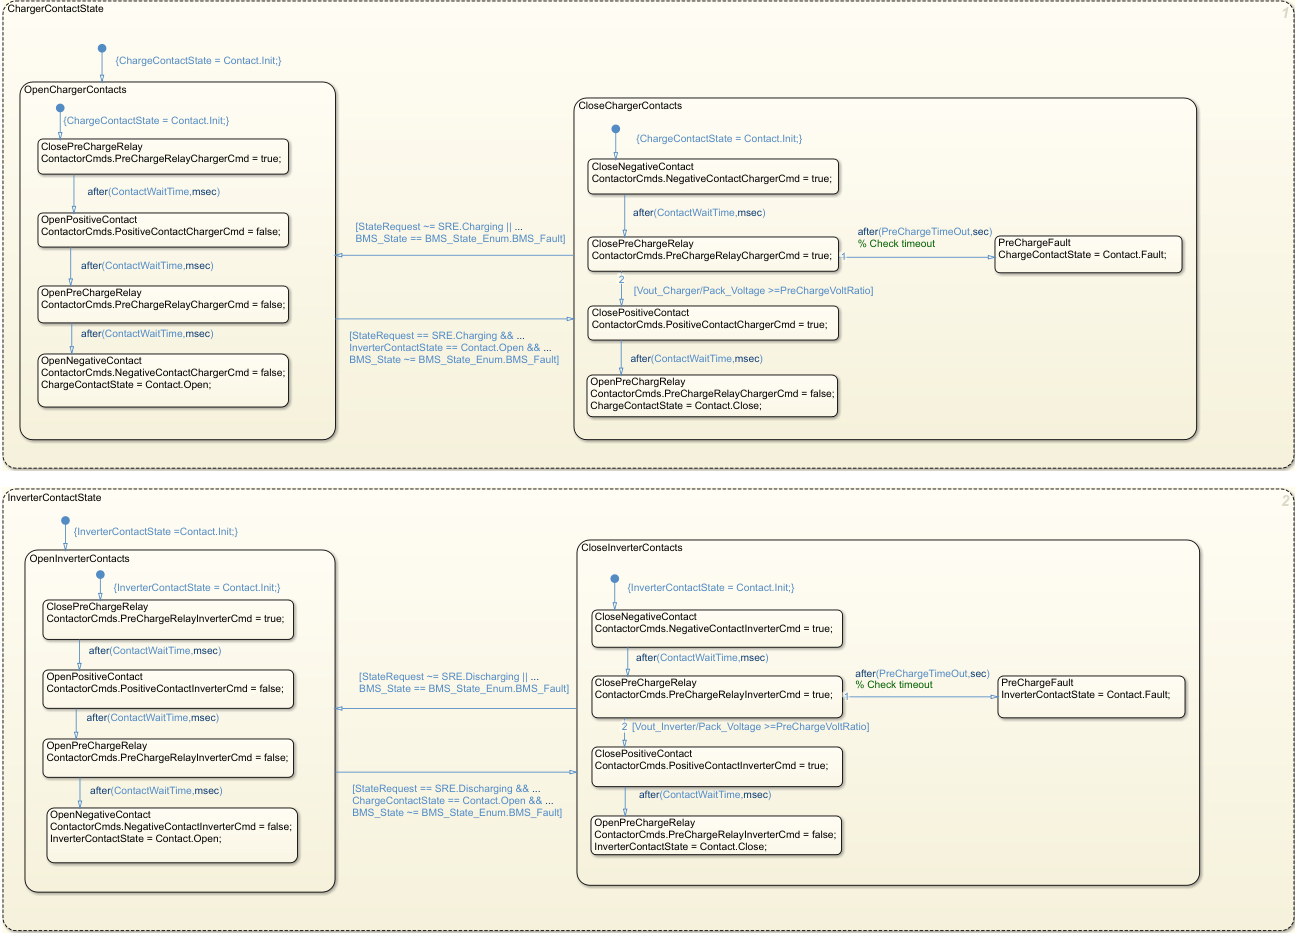
The Contactor_Management chart controls the contactors that connect and disconnect the battery from the charger and the load. The chart contains two parallel states, ChargerContactState and InverterContactState. Each parallel state manages one set of contacts independently. When the chart becomes active, each parallel state defaults to its open-contact state, OpenChargerContacts or OpenInverterContacts. When a charge or discharge request arrives with no active faults, the chart runs a precharge sequence before closing the main contacts. The precharge sequence implements the RC charging behavior described earlier. The chart monitors whether Vload approaches Vbattery according to the expected exponential curve. This equalization prevents high inrush current.
If does not approach within a defined ratio before PreChargeTimeOut expires, the chart transitions to a fault state.
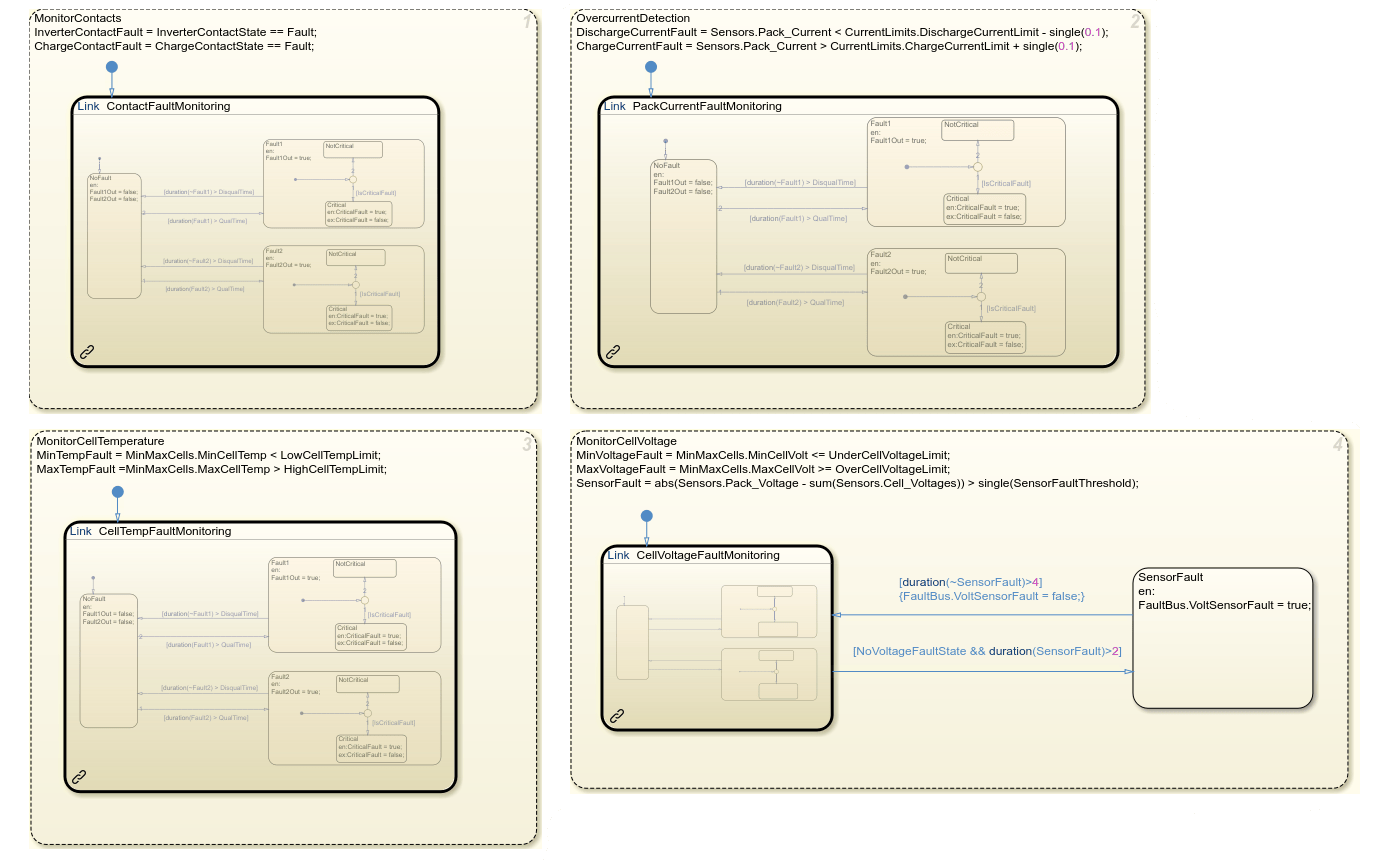
The FaultDetection chart monitors, in parallel, four independent fault states: MonitorContacts, OvercurrentDetection, MonitorCellTemperature, and MonitorCellVoltage. Each parallel state links to an atomic subchart that implements a timer pattern. In the ContactFaultMonitoring subchart, the system starts in the NoFault state. If a fault condition persists for longer than QualTime, the chart transitions to Fault1 or Fault2. The chart then checks if the fault is critical. A critical fault activates the Critical state and sets CriticalFault to true. A noncritical fault activates NotCritical. The timer prevents transient sensor noise from causing false fault events.
Battery Management System
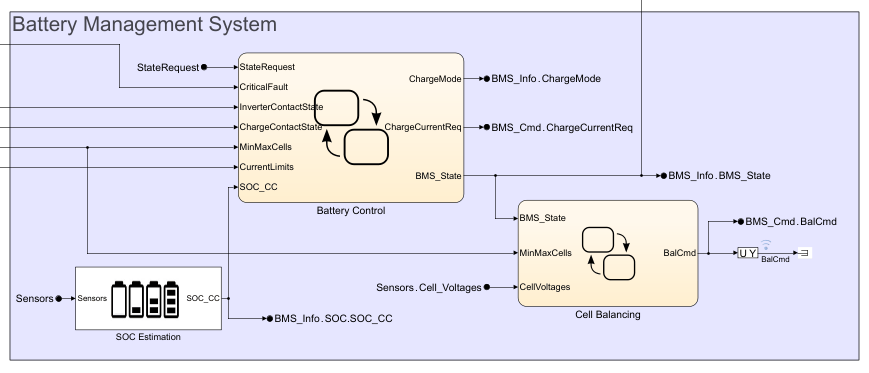
The Battery Management System area contains two Stateflow charts, Battery Control and Cell Balancing, and the SOC Estimation subsystem. While the Power System Control area handles safety-critical fault detection and contactor logic, this area implements the operational BMS functions: state management, charge estimation, and cell balancing.
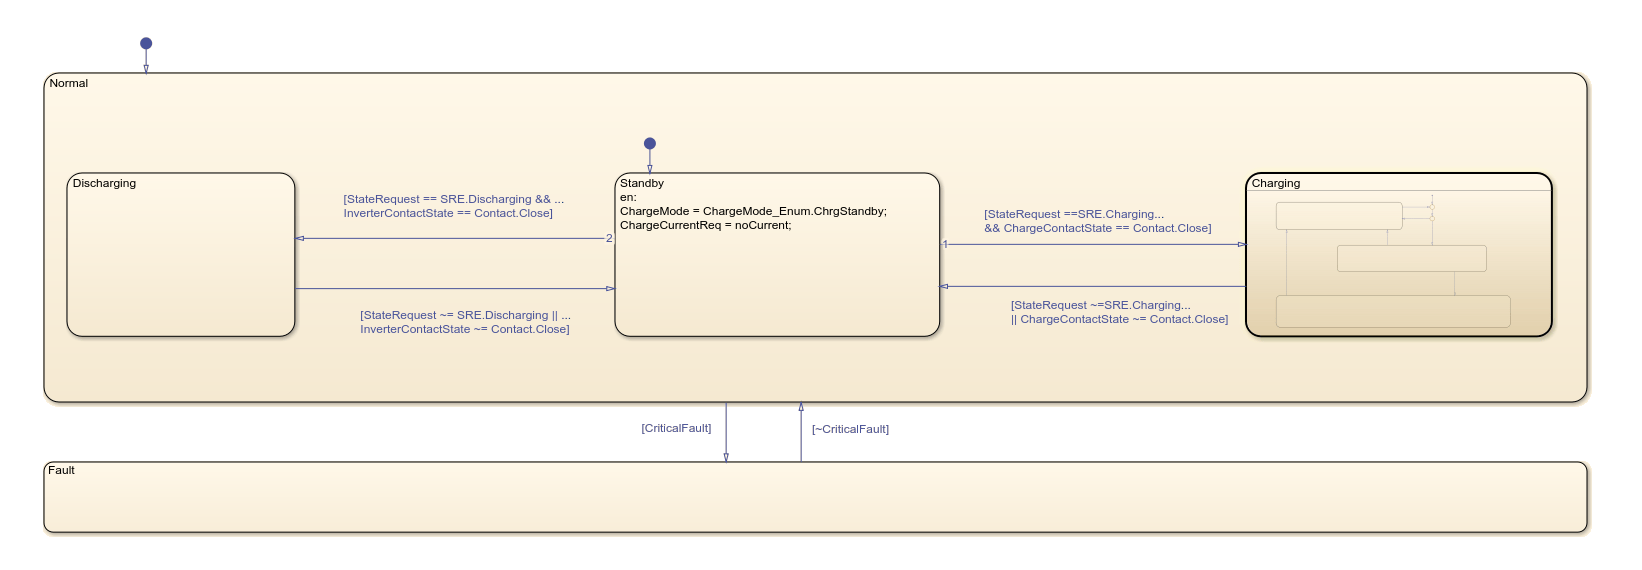
The Battery Control chart manages the top-level operating state of the BMS. When the chart becomes active, it enters the Normal state and transitions by default to the Standby state. In Standby, the chart checks for critical faults. A critical fault transitions the chart to Fault and sets BMS_State to BMS_State_Enum.BMS_Fault. With no critical fault present, the chart checks for discharge and charge requests in order, transitioning to Discharging or Charging when a request exists.
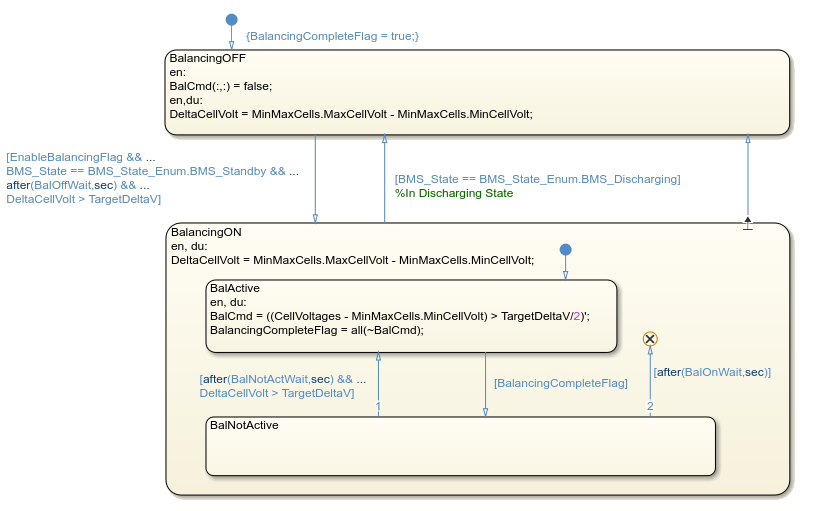
The Cell Balancing chart equalizes voltage across the cells in the battery pack using the passive resistive balancing method described earlier. When cell voltages differ, the chart calculates and generates a balancing command vector. This vector contains one element per cell, where each element is a switch on/off command that controls the bleed resistor for that cell. The chart starts in BalancingOFF. When all balancing conditions are true, the chart transitions to BalancingON. The default child state BalActive then becomes active. When BalancingCompleteFlag becomes true, the BalNotActive state becomes active. The chart returns to BalancingOFF by using an exit port.
The Cell Balancing chart monitors and generates a balancing command vector when exceeds the target threshold TargetDeltaV.
The SOC Estimation subsystem implements the Coulomb counting method described earlier. The subsystem integrates pack current over time, scaled by temperature-dependent capacity, to track the charge remaining in the battery.

Plant Model
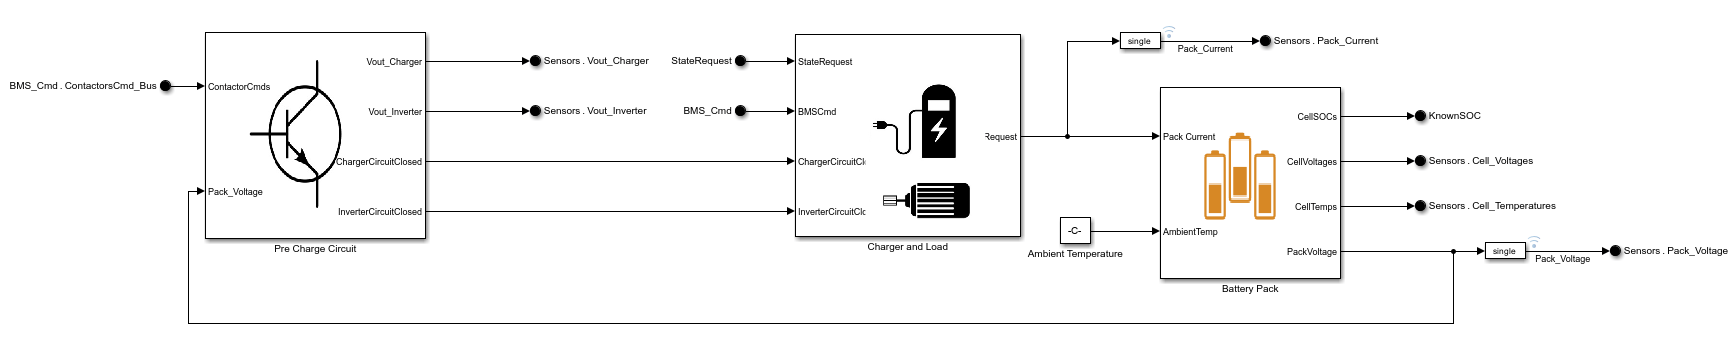
The Plant Model subsystem provides a physics-based representation of the battery for testing the BMS algorithms. The plant model generates the sensor signals (voltage, temperature, and current) that the BMS reads.
The subsystem contains three components. The Charger and Load component simulates the current demanded from or supplied to the battery during each scenario. The Battery Pack component models the battery by using an RC equivalent circuit for voltage and current and a lumped thermal capacity model for temperature. In the RC circuit, R represents the internal resistance of the cell (which causes immediate voltage drop under load), and C represents charge diffusion dynamics (which cause the voltage to relax slowly after a load change). Temperature rises proportionally to I²R losses and falls proportionally to the difference between cell temperature and ambient. The Pre Charge Circuit component simulates the precharge resistor that limits inrush current. An integrator with a held state charges a capacitor until its voltage matches the battery voltage, at which point the main circuit closes.
Simulation Results
Simulate the model to run all three scenarios defined in the Signal Editor block.
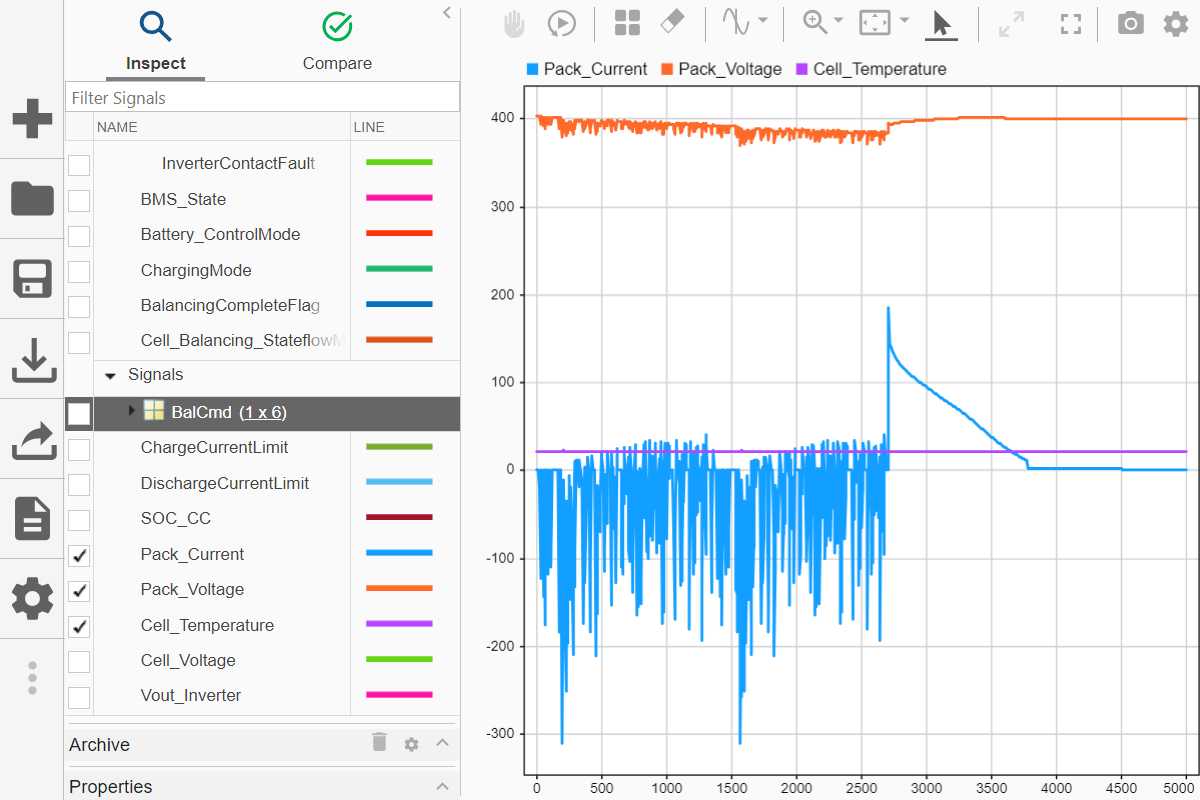
The pack current, pack voltage, and cell temperature change with each scenario. During the Discharging scenario, pack current drops sharply and cell temperature rises as the battery supplies power to the load. Notice that SOC drops linearly during constant-current discharge, which is consistent with the Coulomb counting equation. During the Charging scenario, pack current reverses direction and SOC climbs.
The fault signal output shows where the PackOverCurrentFault triggers. Observe that the fault does not fire instantaneously.
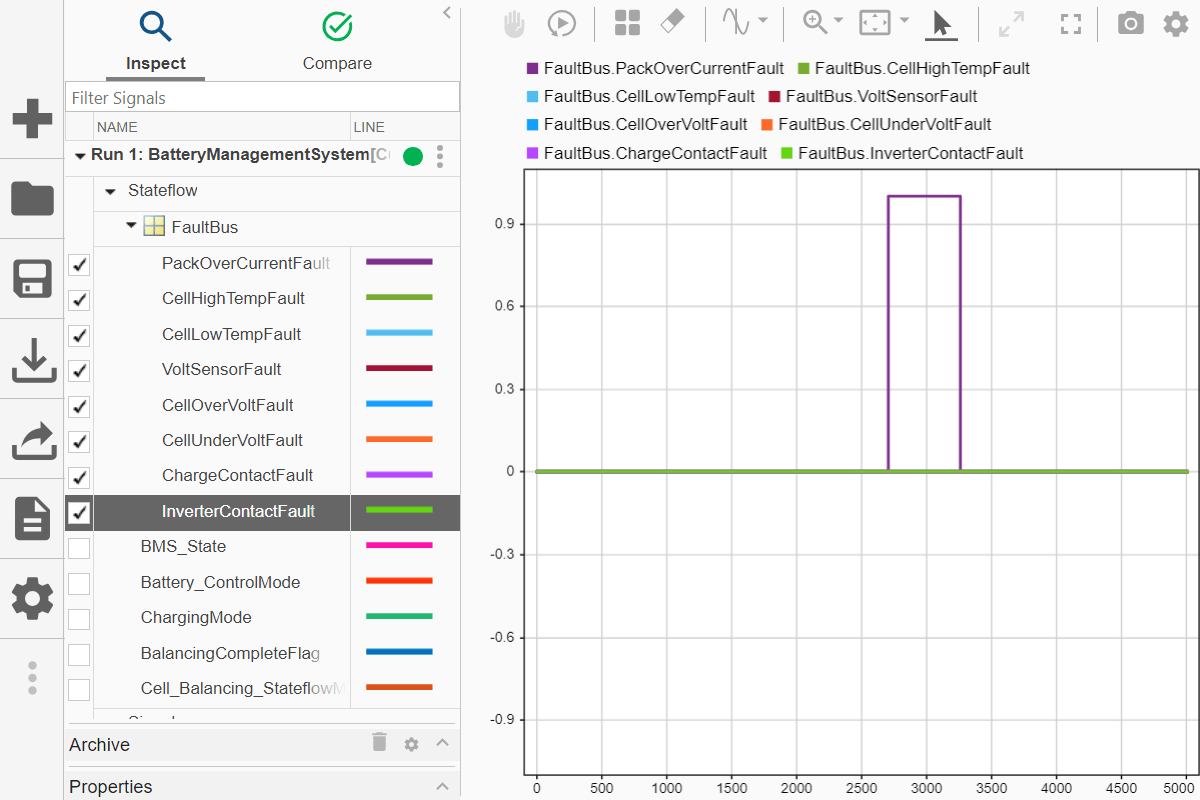
The timer in FaultDetection requires the overcurrent condition to persist for QualTime before the chart exits NoFault. This behavior prevents a current spike from triggering a false fault.
Explore the Model
Modify the model to observe how the BMS responds to different conditions. Before each change, predict the outcome on paper, and then simulate the model to test your hypothesis.
Exercise 1: Change QualTime in the FaultDetection chart to a smaller value and resimulate. Predicted outcome: The PackOverCurrentFault triggers earlier because the timer threshold is shorter. A smaller maturation time makes the system more sensitive to transient overcurrent events. Compare the fault activation time to your prediction.
Exercise 2: Change TargetDeltaV in the Cell Balancing chart to a larger value and resimulate. Predicted outcome: The chart should remain in BalancingOFF longer because the threshold for triggering balancing is now more permissive. A larger threshold tolerates more voltage imbalance before acting. Observe how this affects final cell voltage spread.
Exercise 3: Change the initial SOC value in the SOC Estimation subsystem and resimulate. Predicted outcome: A lower starting SOC causes the system to reach the minimum SOC threshold sooner, transitioning out of Discharging earlier in the simulation. Calculate the expected time to reach the threshold using the Coulomb counting equation and compare to the simulation.

