Integrate MATLAB Functions in a Stateflow Charts
In a Stateflow® chart, you can use MATLAB® functions to help you write algorithms MATLAB language. MATLAB functions are useful for coding algorithms that are more easily expressed by using MATLAB instead of the graphical Stateflow constructs. For more information, see Reuse MATLAB Code by Defining MATLAB Functions.
You can use MATLAB functions to call these types of functions:
Local functions, which are defined in the body of the MATLAB function.
Graphical, Simulink®, truth table, and other MATLAB functions in the chart.
Built-in MATLAB functions that support code generation. These functions generate C code for building targets that conform to the memory and data type requirements of embedded environments.
Extrinsic MATLAB functions that do not support code generation. These functions execute only in the MATLAB workspace during simulation of the model. For more information, see Call Extrinsic MATLAB Functions in Stateflow Charts.
In this example, you build a model that contains two MATLAB functions and then use the functions to calculate the mean and standard deviation of data that you input to the chart.
Build a Stateflow Chart That Contains MATLAB Functions
This example shows how to create a model with a Stateflow chart that calls two MATLAB functions, meanstats
and stdevstats
:
meanstats
calculates the mean of the values invals
.stdevstats
calculates a standard deviation for the values invals
.
Follow these steps:
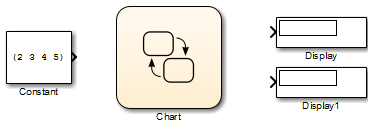
Create a new model with the following blocks:
Save the model as
call_stats_function_stateflow
.In the model, double-click the Chart block.
In the object palette, use the MATLAB function icon to add two functions in the empty chart.
Label each function as shown:
You must label each MATLAB function with its signature. Use the following syntax:
[return_val1,return_val2,...] = function_name(arg1,arg2,...)
You can specify multiple return values and multiple input arguments. Each return value and input argument can be a scalar, vector, or matrix of values. For MATLAB functions with only one return value, you can omit the brackets in the signature label.
In this example, the signatures are
meanout = meanstats(vals)
andstdevout = stdevstats(vals)
.In the chart, add a default transition and connect it to a terminating junction. Add this condition action:
{ mean = meanstats(invals); stdev = stdevstats(invals); }
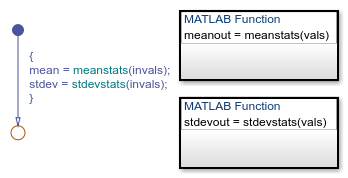
The chart now looks like this:
If the formal arguments of a function signature are scalars, verify that the inputs and outputs of the function calls follow the rules of scalar expansion. For more information, see Assign Values to All Elements of a Matrix.
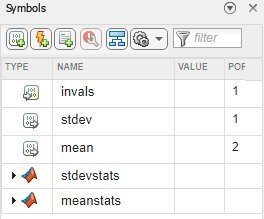
In the Symbols pane, Stateflow shows the undefined data that you created in your chart. Click each symbol image under the Type column, and set
invals
as input data andstdev
andmean
as output data.Connect the Constant and Display blocks to the ports of the Chart block and save the model.
Program MATLAB Functions
To program the functions meanstats
and stdevstats
,
follow these steps:
Open the chart in the model
call_stats_function_stateflow
.Open the function
meanstats
.The function editor appears with the header:
function meanout = meanstats(vals)
The function takes this heading from the function label in the chart. When you edit the header directly in the editor, the changes appear in the chart after you close the editor.
On the line after the function header, enter:
%#codegen
The
%#codegen
compilation directive helps detect compile-time violations of syntax and semantics in MATLAB functions supported for code generation.Enter a line space and add a comment that describes the purpose of the function::
% Calculates the statistical mean for vals
Add the line:
len = length(vals);
The
length
function in MATLAB supports code generation, and returns the length of a vector. For more functions that MATLAB supports for code generation, see Functions and Objects Supported for C/C++ Code Generation (MATLAB Coder).MATLAB functions treat implicitly declared local data as temporary data, which exist only when the function is called and disappear when the function exits. You can declare local data for a MATLAB function in a chart to be persistent by using the
persistent
construct.Enter this line to calculate the value of
meanout
:meanout = avg(vals,len);
The function
meanstats
stores the mean ofvals
in the Stateflow datameanout
. The parent Stateflow chart defines the data, so you can use them directly in the MATLAB function.MATLAB functions treat two-dimensional arrays with a single row or column of elements as vectors or matrices. For example, in
meanstats
, the argumentvals
is a four-element vector. You can access the fourth element of this vector with the matrix notationvals(4,1)
or the vector notationvals(4)
.The MATLAB function uses the functions
avg
andsum
to compute the value ofmean
.sum
is a function supported for code generation.avg
is a local function that you define later. When resolving function names, MATLAB functions in your chart look for local functions first, followed by functions supported for code generation.Note
If you call a function that the MATLAB function cannot resolve as a local function or a function for code generation, you must declare the function to be extrinsic.
Next, define
plot
as extrinsic, since it is not supported for code generation. Enter this statement:coder.extrinsic("plot");
Enter this line to plot the input values in
vals
against their vector index.plot(vals,"-+");
When the MATLAB function encounters an extrinsic function, it sends the call to the MATLAB workspace for execution during simulation.
Next, define the local function
avg
:function meanfcn = avg(inputArray,inputSize) meanfcn = sum(inputArray)/inputSize;
The header for
avg
defines two arguments,inputArray
andinputSize
, and a single return value,mean
. The local functionavg
calculates the average of the elements ininputArray
by dividing their sum by the value of argumentinputSize
.The complete code for the function
meanstats
looks like this:function meanout = meanstats(vals) %#codegen % Calculates the statistical mean for vals len = length(vals); meanout = avg(vals,len); coder.extrinsic("plot"); plot(vals,"-+"); function meanfcn = avg(inputArray,inputSize) meanfcn = sum(inputArray)/inputSize;
Save the model.
In the Stateflow chart, open the function
stdevstats
and add code to compute the standard deviation of the values invals
. The complete code looks like this:function stdevout = stdevstats(vals) %#codegen % Calculates the standard deviation for vals len = length(vals); stdevout = sqrt(sum(((vals-avg(vals,len)).^2))/len); function meanfcn = avg(inputArray,inputSize) meanfcn = sum(inputArray)/inputSize;
Save the model again.
See Also
coder.extrinsic
(Simulink)