Reuse a State Multiple Times in a Chart
This example shows how to use linked atomic subcharts to repeat the same configuration of states and transitions multiple times in a Stateflow® chart. For more information, see Create Reusable Subcomponents by Using Atomic Subcharts.
Original Model Without Atomic Subcharts
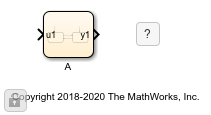
This model contains two Sine Wave (Simulink) blocks: one with a frequency of 1 radian per second, and the other with a frequency of 2 radians per second.
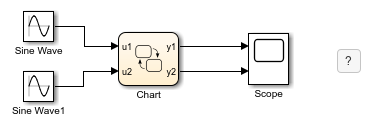
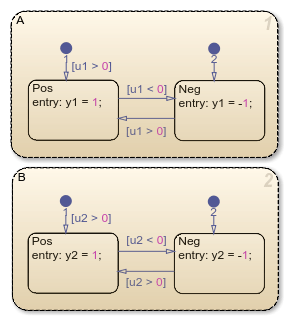
In the chart, each state uses saturator logic to convert the input sine wave to an output square wave of the same frequency. The states perform the same actions and differ only in the names of their input and output data.
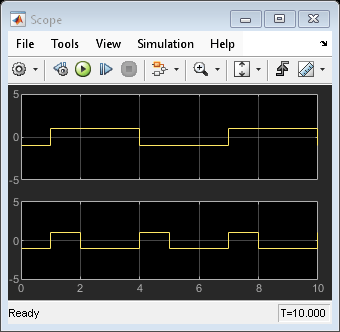
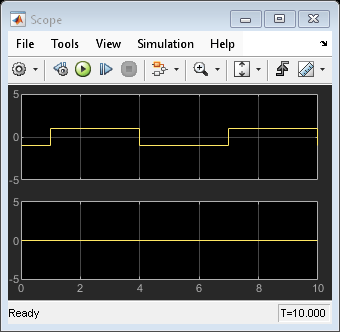
Simulating the model produces these results.
Because this example does not use atomic subcharts, you have to maintain each subcomponent manually. For example, if you change the logic in state A, then you must make the same change in state B.
In contrast, if you replace the states in this example with atomic subcharts, you can reuse the same object in your model and retain the same simulation results. You can save state A as an atomic subchart in a library model and then use multiple linked instances of that subchart in your chart. Changes in the library model propagate to all linked instances of the subchart.
Edit Model to Use Atomic Subcharts
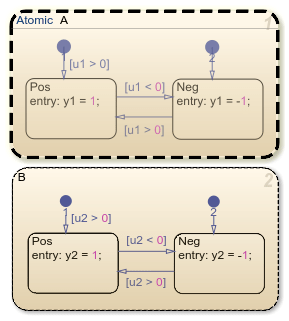
Step 1: Convert a State to an Atomic Subchart
Right-click state A and select Group & Subchart > Atomic Subchart. State A changes to an atomic subchart and displays the label Atomic in the upper-left corner.
Step 2: Create a Library for the Atomic Subchart
Create a new library model.
Copy the atomic subchart and paste it in your library model.
Save your library model.
In the library model, the atomic subchart appears as an independent chart with an input port and an output port.
Step 3: Replace States with Linked Atomic Subcharts
Delete both states in the chart.
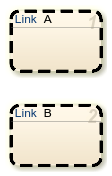
Copy the atomic subchart in your library and paste it in your chart twice.
Change the name of the second atomic subchart to
B.
Each linked atomic subchart appears opaque and contains the label Link in the upper-left corner.
Step 4: Edit the Mapping of Input and Output Variables
If you simulate the model now, the output for y2 is zero. You also see warnings about unused data. These warnings appear because atomic subchart B uses u1 and y1 instead of u2 and y2.
To fix these warnings, you must edit the mapping of input and output variables.
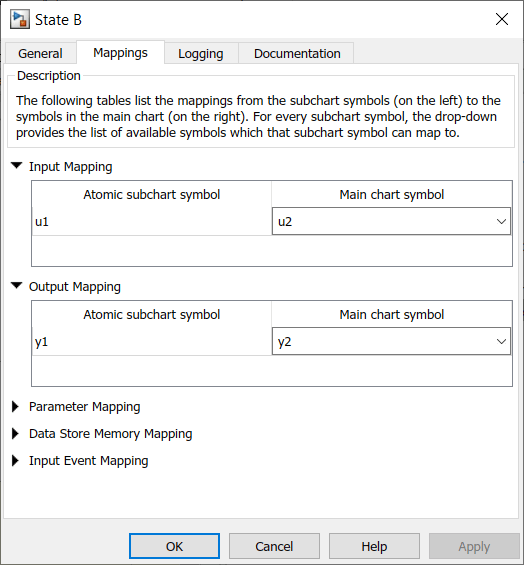
Right-click subchart
Band select Subchart Mappings.Under Input Mapping, specify the main chart symbol for
u1to beu2.Under Output Mapping, specify the main chart symbol for
y1to bey2.Click OK.
Run New Model
When you simulate the new model, the results match those of the original design.

Propagate Change in Library Chart
Suppose that, in the library chart, you edit the transition from Pos to Neg.

This change propagates to all linked atomic subcharts in your main chart. You do not have to update each state individually.
See Also
Sine Wave (Simulink)