Robust Fitting Tool
R2026bInteractive robust regression
Description
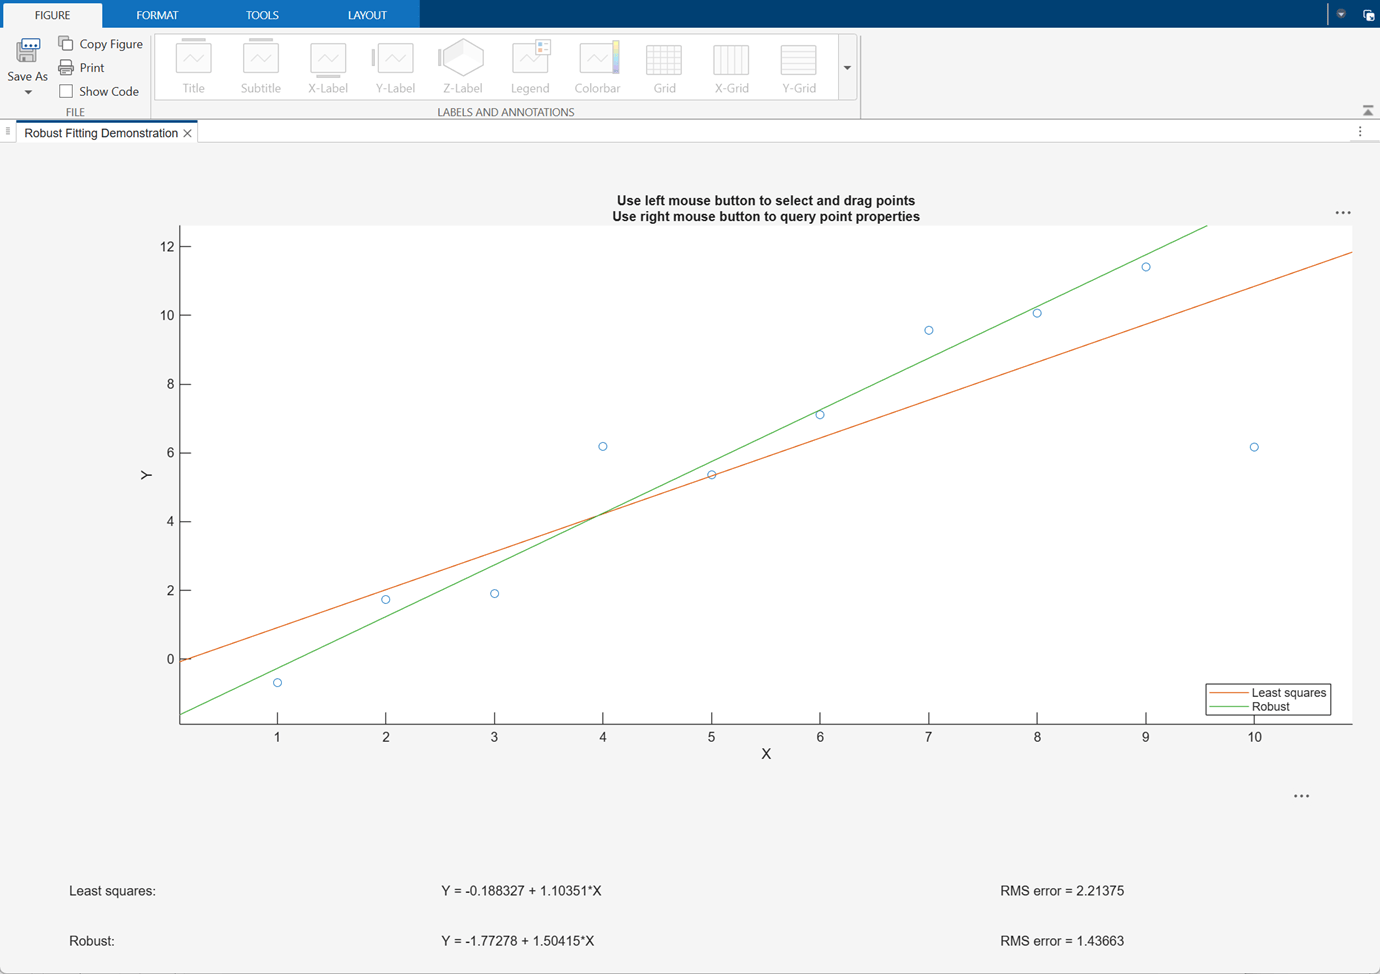
The Robust Fitting tool fits an ordinary least-squares regression model and a robust regression model to data with a single predictor.
The tool displays a scatter plot of the data and the regression fit lines. Right-click any data point to see its least-squares leverage and robust weight. You can drag any data point to a new location and the tool updates the regression fits automatically.
Required Products
MATLAB®
Statistics and Machine Learning Toolbox™
Open the Robust Fitting Tool
MATLAB command prompt: Enter
robustdemo.
Examples
This example shows how to start an interactive fitting session with
robustdemo.
Generate data from a linear function with added noise.
rng(0,"twister") % for reproducibility
x = -5:5;
y = x + 2*randn(size(x));
Change the value at x = 10 to make it an
outlier.
y(10)=30;
Fit an ordinary least-squares regression model and a robust regression model to the data.
robustdemo(x,y)

The tool displays a scatter plot with two fitted lines. The red line is the fit using ordinary least-squares regression. The green line is the fit using robust regression. Below the plot, the tool displays the equations for the fitted lines, as well as the estimated root mean squared errors for each fit.
Right-click any data point to see its least-squares leverage and robust weight.
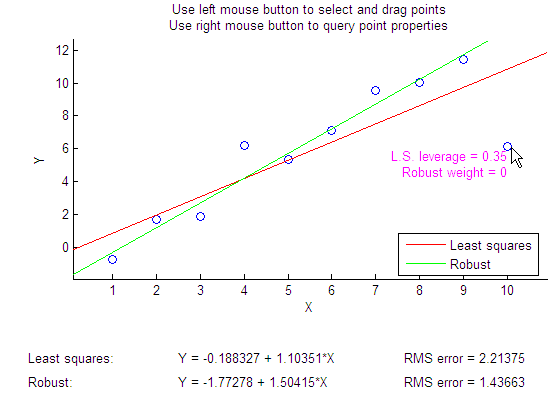
The right-most point has a relatively high leverage of 0.32. The point exerts a large influence on the least-squares fit, but its small robust weight indicates that it is effectively excluded from the robust fit.
To see how a change in the data affects the fits, click and drag any data point to a new location. The tool displays the updated fits, and you can right-click the point to see the updated leverage and weight.
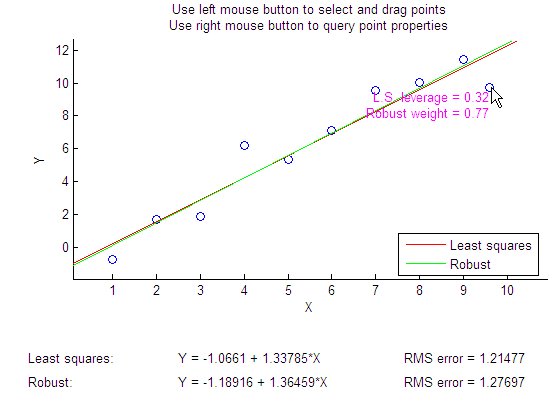
Moving the right-most data point closer to the least-squares line makes the two fitted lines nearly identical. The adjusted data point has significant weight in the robust fit.
Programmatic Use
Version History
Introduced before R2006a

