Cell Counting
R2026bThis example shows how to use a combination of basic morphological operators and blob analysis to extract information from a video stream. In this case, the example counts the number of E. Coli bacteria in each video frame. Note that the cells are of varying brightness, which makes the task of segmentation more challenging.
Initialization
Use these next sections of code to initialize the required variables and objects.
VideoSize = [432 528];
Create a System object to read video from avi file.
filename = 'ecolicells.avi';
hvfr = VideoReader(filename);
Create a BlobAnalysis System object to find the centroid of the segmented cells in the video.
hblob = vision.BlobAnalysis( ...
                'AreaOutputPort', false, ...
                'BoundingBoxOutputPort', false, ...
                'OutputDataType', 'single', ...
                'MinimumBlobArea', 7, ...
                'MaximumBlobArea', 300, ...
                'MaximumCount', 1500);

% Acknowledgement
ackText = ['Data set courtesy of Jonathan Young and Michael Elowitz, ' ...
             'California Institute of Technology'];
Create a System object to display the video.
hVideo = vision.VideoPlayer;
hVideo.Name  = 'Results';
hVideo.Position(1) = round(hVideo.Position(1));
hVideo.Position(2) = round(hVideo.Position(2));
hVideo.Position([4 3]) = 30+VideoSize;
Stream Processing Loop
Create a processing loop to count the number of cells in the input video. This loop uses the System objects you instantiated above.
frameCount = int16(1);
while hasFrame(hvfr)
    % Read input video frame
    image = im2gray(im2single(readFrame(hvfr)));

    % Apply a combination of morphological dilation and image arithmetic
    % operations to remove uneven illumination and to emphasize the
    % boundaries between the cells.
    y1 = 2*image - imdilate(image, strel('square',7));
    y1(y1<0) = 0;
    y1(y1>1) = 1;
    y2 = imdilate(y1, strel('square',7)) - y1;

    th = multithresh(y2);      % Determine threshold using Otsu's method
    y3 = (y2 <= th*0.7);       % Binarize the image.

    Centroid = step(hblob, y3);   % Calculate the centroid
    numBlobs = size(Centroid,1);  % and number of cells.
    % Display the number of frames and cells.
    frameBlobTxt = sprintf('Frame %d, Count %d', frameCount, numBlobs);
    image = insertText(image, [1 1], frameBlobTxt, ...
            'FontSize', 16, 'BoxOpacity', 0, 'FontColor', 'white');
    image = insertText(image, [1 size(image,1)], ackText, ...
            'FontSize', 10, 'AnchorPoint', 'LeftBottom', ...
            'BoxOpacity', 0, 'FontColor', 'white');

    % Display video
    image_out = insertMarker(image, Centroid, '*', 'MarkerColor', 'green');
    step(hVideo, image_out);

    frameCount = frameCount + 1;
    pause(1);
end
Summary
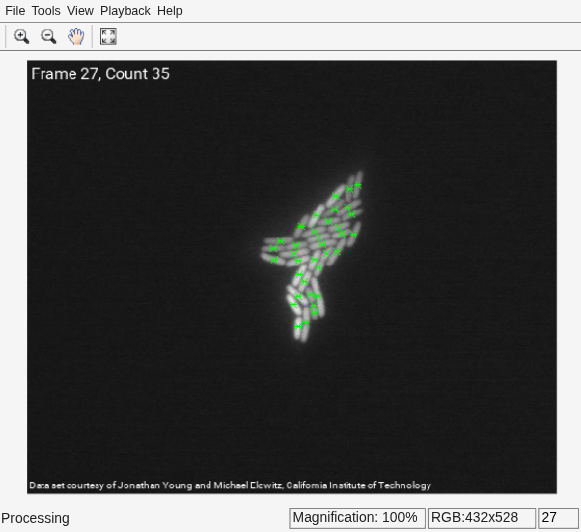
In the Results window the original video is shown and the green markers indicate the centroid locations of the cells. The frame number and the number of cells are displayed in the upper left corner.
Data Set Credits
The data set for this example was provided by Jonathan Young and Michael Elowitz from California Institute of Technology. It is used with permission. For additional information about this data, see
N. Rosenfeld, J. Young, U. Alon, P. Swain, and M.B. Elowitz, "Gene Regulation at the Single-Cell Level, " Science 2005, Vol. 307, pp. 1962-1965.

