Triggered Capture Using Preamble Detection
This example shows how to use a software-defined radio (SDR) to capture data from the air using preamble detection. The example also shows how to use the transmit capabilities of the same radio to loop back a test waveform.
Set Up Radio
Call the radioConfigurations function. The function returns all available radio setup configurations that you saved using the Radio Setup wizard.
savedRadioConfigurations = radioConfigurations;
To update the dropdown menu with your saved radio setup configuration names, click Update. Then select the radio to use with this example.
savedRadioConfigurationNames = [string({savedRadioConfigurations.Name})];
radio = savedRadioConfigurationNames(1) ;
;Generate Transmission Waveform
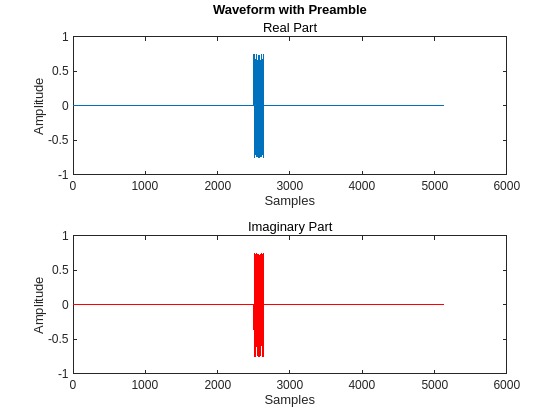
Create a transmission waveform containing a Zadoff-Chu preamble sequence. To enable straightforward demonstration of the preamble detection workflow, concatenate zeros before and after the preamble.
Generate a preamble sequence of length 137 by using 38th root of the Zadoff-Chu sequence and normalize. Concatenate with zeros.
zcseq = zadoffChuSeq(38,137);
preamble = zcseq/norm(zcseq,2);
prePadLen = 2501;
postPadLen = 2500;
headSignal = complex(zeros(prePadLen,1),zeros(prePadLen,1));
rearSignal = complex(zeros(postPadLen,1),zeros(postPadLen,1));
inputSignal = [headSignal; zcseq*0.75; rearSignal];
Plot the transmission waveform.
figure();
subplot(2,1,1); plot(real(inputSignal));
subtitle("Real Part");
xlabel("Samples");
ylabel("Amplitude");
title("Waveform with Preamble");
subplot(2,1,2);
plot(imag(inputSignal),Color="r");
subtitle("Imaginary Part");
xlabel("Samples");
ylabel("Amplitude");
Configure Preamble Detector
Create a preambleDetector object with the specified radio. Because the object requires exclusive access to radio hardware resources, before running this example for the first time, clear any other object associated with the specified radio. To speed up the execution time of the example in subsequent runs, reuse your new workspace object.
if ~exist("pd","var")
    pd = preambleDetector(radio);
end
Set the RF properties of the preamble detector. Set the RadioGain property according to the local wireless channel.
pd.SampleRate =30720000; pd.CenterFrequency =
2450000000; pd.RadioGain =
30; % Increase if signal levels are low
To update the dropdown menu with the antennas available for capture on your radio, call the hCaptureAntennas helper function. Then select the antenna to use with this example.
captureAntennaSelection = hCaptureAntennas(radio);
pd.Antennas = captureAntennaSelection(2);
Configure the preamble sequence for preamble detection.
pd.Preamble = preamble;
Set the capture data type to the data type of the generated transmission waveform.
pd.CaptureDataType = "double";Configure Transmission Variables
Set the transmit gain and transmit antenna values. Set the transmit gain variable according to the local wireless channel.
txGain =30; % Increase if signal levels are low.
To update the dropdown menu with the antennas available for transmit on your radio, call the hTransmitAntennas helper function. Then select the antenna to use with this example.
transmitAntennaSelection = hTransmitAntennas(radio);
txAntenna = transmitAntennaSelection(2);
 Detect Preamble Using Fixed Threshold and Capture Data
When the threshold calculation method is set to "fixed", data capture is triggered when the correlator output is greater than the fixed threshold. By setting the fixed threshold to 0, you can analyze the behavior of the preamble detector and understand how to set the fixed threshold value for successful detection.
To set the threshold method, first stop any ongoing transmission by calling the stopTransmission function. Set the preamble detector to use fixed threshold.
stopTransmission(pd);
pd.ThresholdMethod = "fixed";
Set the fixed threshold initially to 0.
pd.FixedThreshold = 0;
Transmit the test waveform by using the transmit function.
transmit(pd,inputSignal,"continuous", ...
    TransmitGain=txGain, ...
    TransmitCenterFrequency=pd.CenterFrequency, ...
    TransmitAntennas=txAntenna);
Use the plotThreshold function to analyze the behavior of the detector by plotting 10,000 samples. Because the fixed threshold value is 0, all samples from the correlator output are possible trigger points. Check the correlator output values at the peak trigger points. Because the sampling phase determines the quality of the correlator peak, run the plotThreshold function multiple times to see how the trigger points change.
plotThreshold(pd,10e3);

Choose a threshold value that is less than the peak value of the correlator output power. Plot the threshold information again and adjust the fixed threshold until the trigger points appear only on the correlator output peak. Run the plotThreshold function multiple times to see any sampling phase effects.
pd.FixedThreshold = 0.01;
plotThreshold(pd,10e3);
0.01;
plotThreshold(pd,10e3);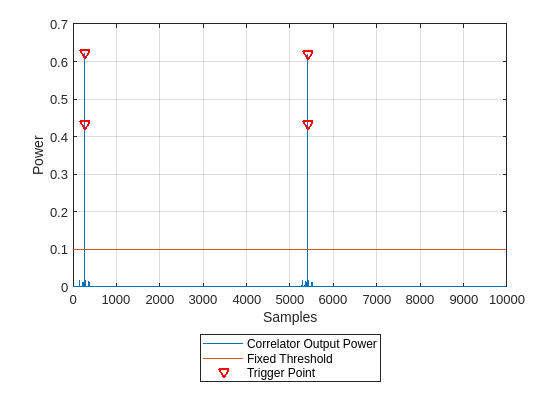
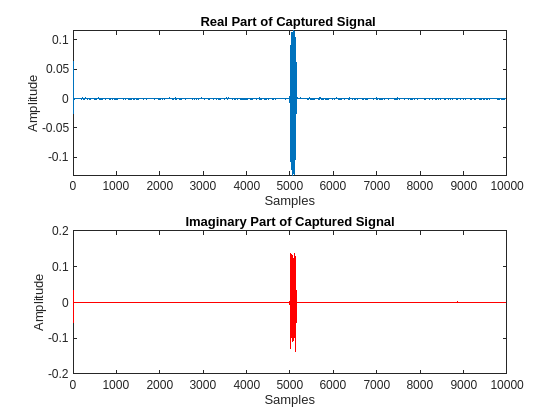
Once the threshold is set, capture data.
[data,~,~,status] = capture(pd,10e3,seconds(1));
Use the hPlotCapturedData helper function to plot the captured signal.
hPlotCapturedData(data,status);

Detect Preamble Using Adaptive Threshold and Capture Data
As an alternative to the fixed threshold, data capture can be triggered when the correlator output is greater than an adaptive threshold, which dynamically varies with the input signal power. By setting the adaptive threshold gain and offset to 0, you can analyze the behavior of the preamble detector and understand how to configure the adaptive threshold for successful detection.
To set the threshold method, stop any ongoing transmission, and set the preamble detector to use adaptive threshold.
stopTransmission(pd);
pd.ThresholdMethod = "adaptive";
Set the adaptive threshold gain and offset initially to 0.
pd.AdaptiveThresholdGain = 0;
pd.AdaptiveThresholdOffset = 0;
Transmit the test waveform.
transmit(pd,inputSignal,"continuous", ...
    TransmitGain=txGain, ...
    TransmitCenterFrequency=pd.CenterFrequency, ...
    TransmitAntennas=txAntenna);
Use the plotThreshold function to analyze the behavior of the detector by plotting 10,000 samples. Check the correlator output values at the peak trigger points, adjust the thresholds, and plot the preamble detection signals. Repeat this multiple times if necessary.
plotThreshold(pd,10e3);
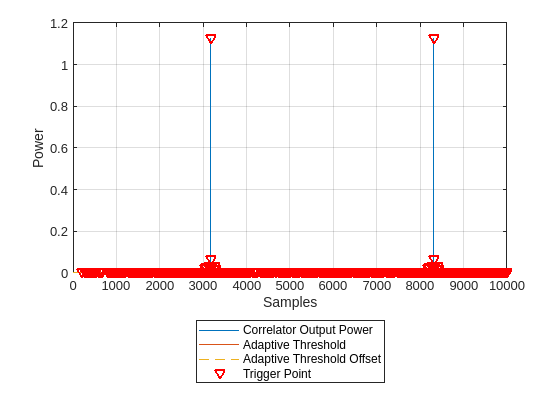
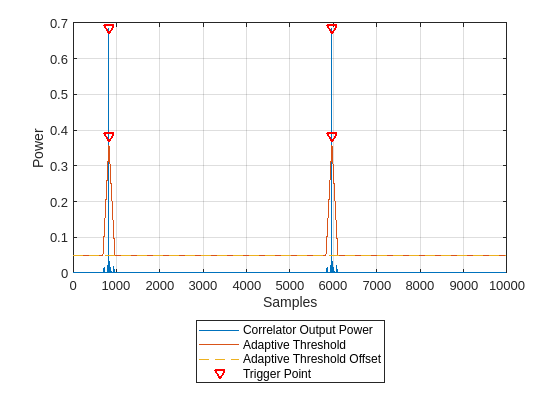
To remove all the trigger points from the bottom of the plot, set the adaptive threshold offset to a value that is above the noise floor. Adjust the adaptive threshold gain and plot the threshold information repeatedly until the correlator output is greater than the adaptive threshold.
pd.AdaptiveThresholdOffset =0.01; pd.AdaptiveThresholdGain =
0.25; plotThreshold(pd,10e3);
Once the threshold is configured, capture data and plot the captured signal.
[data,~,~,status] = capture(pd,10e3,seconds(1));
hPlotCapturedData(data,status);
Detect Multiple Consecutive Signals
You can detect multiple consecutive signals by setting the NumCaptures name-value argument to a value greater than 1. To capture three consecutive signals using the same adaptive thresholding criteria, set the NumCaptures property to 3. Then, use the hPlotCapturedData helper function to plot the captured signals.
[data,timestamps,~,status] = capture(pd,10e3,seconds(3),NumCaptures=3);
hPlotCapturedData(data, status);

Display the timestamp for each capture. The timestamps are returned in datetime format to nanosecond precision.
disp(timestamps);
   20-Feb-2024 10:24:45.000754936
   20-Feb-2024 10:24:45.001089441
   20-Feb-2024 10:24:45.001423946
Set Trigger Offset to Include Preamble in Captured Data
To capture the preamble sequence, stop any ongoing transmission and set the trigger offset to the length of the preamble. To capture additional samples before the preamble sequence, increase this value.
stopTransmission(pd);
pd.TriggerOffset = -137;
-137;Transmit the test waveform, capture data, and plot.
transmit(pd,inputSignal,"continuous", ...
    TransmitGain=txGain,...
    TransmitCenterFrequency=pd.CenterFrequency, ...
    TransmitAntennas=txAntenna);
% Detect and capture 10,000 samples, with a 1 second timeout
[data,~,~, status] = capture(pd,10e3,seconds(1));
hPlotCapturedData(data,status);

End Transmission
To end the continuous transmission, call the stopTransmission function on the preamble detector object.
stopTransmission(pd);