
Transforms map data into lat/lon coordinates for a polar stereographic map projection. NSIDC/SCAR
The National Snow and Ice Data Center (NSIDC) and Scientific Committee on Antarctic Research (SCAR) use a version of the polar stereographic projection that Matlab does not have. This file does
Transforms lat/lon data into map coordinates for a polar stereographic map projection. NSIDC/SCAR
POLARSTEREO_FWD transforms lat/lon data to map coordinates for a polar stereographic system [X,Y]=POLARSTEREO_FWD(LAT,LONG,EARTHRADIUS,ECCENTRICITY,LAT_TRUE,LON_POSY) X and Y are the map
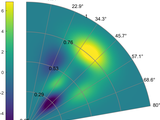
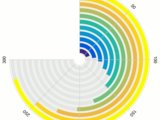
polarPcolor draws a pseudocolor plot in polar coordinates with a polar grid.
pcolor in polar coordinatespolarPcolor draws a pseudocolor plot in polar coordinates with a polar grid.SummarypolarPcolor aims to represent a pseudocolour plot in polar coordinates, with a radial
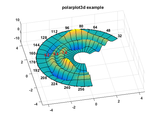
Plots 3d polar data with polar axis and polar grid
Polarplot3d produces surface, mesh, wireframe and contour plots for three dimensional polar data. A labeled polar axis is drawn at a fixed height or it can follow the surface contour at maximum
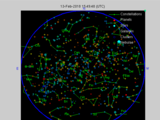
A skychart for Matlab: display the sky view

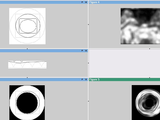
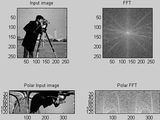
Workflow for modifying Cartesian images in the polar coordinate system.
imcart2polConverts 2D Cartesian images to polar coordinate images, i.e. "unwraps" them about an origin. The result is a rectangular image whose vertical axis is radial, and horizontal axis is
converts rectangular image to polar and back
Conversion from Rectangular to Polar Image and back from Polar to Rectangular.Image Processing Toolbox required only for loading and displaying imagesV0.1 16 Dec 2007 (Created), Prakash Manandhar
Polar plots with handle graphics type parameter setting. Includes log radius support.
Attempts to bring comprehensive handle graphics capabilities to polar plots.
Polar Coordinates Transform
This script is used to transform a given image from cartesian coordinates to polar coordinates.

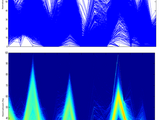
Bivariate histogram plot from polar coordinates / position vectors in MATLAB.
Bivariate histogram plot from polar coordinates / position vectors.Esentially, the coordinates are converted to cartesian coordinates and fed toHISTOGRAM2. A polar-coordinate grid is then drawn in

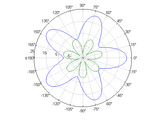
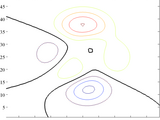
Creates a contour plot from polar coordinates
Have you ever wanted to do a contour plot of data in polar coordinates but didn't want to go through the hassle of converting it all to Cartesian coordinates? Well if so, here's your answer. A
Change the representation from cartesian coordinates to polar ones for a 2D color-gray image.
to a polar representation showing the visual appearance of the real ultrasound images. It is required also to have the possibility of acting on the inner and outer representation radii and on the
polar coordinates with angular range [0 pi]; specified line style and tick value.
HALFPOLAR function performs the polar plot in radian angle range [0 pi] using half polar coordinates HALFPOLAR(phi,gain) makes a plot with phi in radians angle range [0 pi] and gain in half
Plots 3D polar data with axes.
Polar3D plots 3 dimensional data given angular and radial ranges. A choice of plot types and interpolation methods is supported by this function. Useful particularly in producing 3D plots sampled on
An update to Matlabs built-in polar.m
A polar plot script that allows selection of axis limits by the user, including negative radial limits. It is particularly appropriate for logarithmic data.A known limitation is that datapoints

Resamples an image from a conventional grid to a log-polar grid, and back.
Images sampled on a log-polar grid have interesting and useful properties. Rotation and scaling are trivial operations, and this can lead to efficient algorithms for straight line detection and optic

Generates polar stereographic maps of the Arctic or Antarctic as a square or rectangular plot.
This simple function generates polar stereographic maps of the Arctic and Antarctic with rectangular boundaries using Matlab's Mapping Toolbox. Typically, polar stereographic maps in Matlab appear
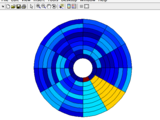
This function creates smooth patches of polar data in "bullseye" plot.
BULLSEYE plots patch data in polar coordinates. The DATA matrix is mapped to a bullseye plot as follows. The matrix rows are mapped to the circumference and matrix columns are mapped to radial
Bar graph plotted on polar coordinate system
radialBar creates a bar graph on polar coordinate system. It could be considered as a mix between "polar" and "bar" functions.See demo provided in the zip file.

Functions to generate fully customizable polar plots including compass orientation and circle segments.
Although current versions of Matlab do offer some polar plotting functionality, it isn't particularly flexible. "Perfect Polar Plots" is a few functions which can be used to create fully customizable

Draws a modified "polar" scatter plot
degree sector, and each point within a data set is plotted inside the appropriate sector. This is done by computing the point's polar coordinate, and mapping the resulting angle component on to the

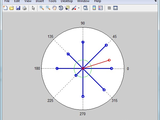
MATLAB phasors
Useful for electric phasors. Functions:Descripe phasors in polar as: R = [Length Angle]a = [30 40]b = [10 30]c = [40 -59]Pkon: Complex conjugatepkon(c) == [40 59]Pmult: Polar

Calculates CIExy coordinate of a light source using photo luminescence data and predict color.

Unwarp the circular objects appearing in images using inverse polar transform.
This work transforms the polar coordinate representation of an image back onto an annular arc in cartesian coordinates. The result contains an interpolated image where the circular structures are
Convert values given by a contour matrix to easy-to-use cells.
Visualize and manipulate parallel coordinate plots with this GUI. UNIVERSITY OF BRISTOL

This app convert polar coordinates to rectangular coordinates and vice versa.
Enter the Polar coordinate values i. e. Magnitude and Angle in the respective input field and click the button to get Real and Imaginary values in the output field.Enter the Rectangular coordinate

Plot monthly sky maps (stars above the local horizon) for any location on the Earth. Including planets.
Utilities for manipulating GPS position data
A collection of utilities for translating GPS coordinates to related coordinate systems (Earth Centere Fixed, Topocentric, UTM) with auxiliary routins for horizon computation and ray ellipsoid

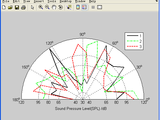
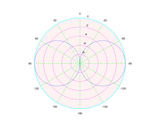
polar_dB makes a plot of gain=10*log10(g) versus polar angles phi
Hi everyone,this is a basic polar plot tool in dB , you can change the range which can be very helpful for analyze the nature of your pattern.Here is a test code:%------------------------% Linear
Adjusts circumference ticks on polar plots
For matlab versions prior to 2016, you cannot adjust the tick intervals on polar plots but the current polar.m code has hard-coded intervals of 30deg. polarticks.m allows the user to adjust those

Corneal Topography: Constructing Curvature Topography from Placido Rings Image

Signal coding using different line codes: Manchester, unipolar and polar RZ, unipolar NRZ
Signal coding using different line codes: Manchester, unipolar and polar RZ, unipolar NRZ


Perform the polar decomposition of a regular square matrix

This app helps to understand and visualise three dimensional cylindrical coordinate system.
In a three-dimensional space a point can be located as the intersection of three orthogonal surfaces..This app help to understand cylindrical coordinate system. Unit vectors and differential lengths
The software solves the power flow problem in rectangular coordinates

This app helps to understand and visualise three dimensional cartesian coordinate system.
In a three-dimensional space a point can be located as the intersection of three orthogonal surfaces. This app help to understand cartesian coordinate system. Unit vectors and differential lengths
Advanced polar plots.
An improved version of the MATLAB function 'polar'. Supports negative numbers and other plotting features.

This Function calculate the divergence of 3D symbolic vector field
This Function calculates the divergence of the 3D symbolic vector in Cartesian, Cylindrical, and Spherical coordinate system.function Div = divergence_sym(V,X,coordinate_system)V is the 3D symbolic

Polar diagram for unbalance 3 phase system
This model simulates an unbalance 3 phase system. in addition, a dynamic polar diagram is shown to check the voltage phasors.
Polar plot with vertical reference axis and direction changes clockwise, like a compass rose.
This function, named polargeo.m, is based on MATLAB's polar plotting function. The polar function has been modified so that the reference axis is oriented vertically instead of horizontally and the

Creates circular / polar / angle histograms
CircHist creates circular (polar) histograms from angle data, either distribution data or already-binned data. Works with circular and axial (bimodal) data. Circular statistics (average angle, 95 %

Draws a polar dendrogram.
polar dendrogram, which spreads out the leaf nodes around the circumference of a circle.

Create a polar histogram
This is an example of how to create a polar histogram in MATLAB®.Read about the "polarhistogram" function in the MATLAB documentation. This function is available in R2016b or newer.For more examples

This is an interactive GUI illustrating Complex Numbers (Cartesian to Polar). Read the description before download.
Forward and inverse 3D pseudo polar Fourier transforms and Radon transforms
Description: This package contains functions for 3D pseudo polar Fourier and Radon transforms. More specifically, includes for each a forward transform (i.e. taking an image and computing its 3D
GIBBON: The Geometry and Image-Based Bioengineering add-ON for MATLAB

his is an interactive GUI illustrating Complex Numbers (Polar to Cartesian). Read the description before download.
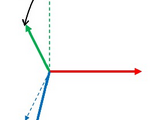
3D Space Coordinate Transformations
3d-coordinate-transformations3D Space Coordinate Transformations for Robotics ApplicationsThis folder contains 3 files (m-functions) :t2x.m Transformation Matrix to Generalized Position Vector.x2t.m

Like dsxy2figxy or ds2nfu, also work for 3D axes. An utility function to help annotation.

Calculation of unperturbed ephemerides with arbitrary eccentricity for comets and minor planets
Interactive MATLAB script that can be used to perform time and coordinate calculations.
PDF document and interactive MATLAB script called csystems.m which can be used to perform a variety of time and coordinate calculations. This script performs the following types of time
The function performs both reverse and direct problem-solving based on dual quaternions between two Cartesian coordinate systems (3D and 2D)
and direct problem-solving based on dual quaternions between two 3D Cartesian coordinate system% The function can also 2D transformation between given coordinate systems.% INPUT:% n :number of control
Change image coordinate from standard image coordinate to polar coordinate, vice versa.
image2polar:Change image from standard image coordinate (Left-Right,Top-Down) to polar coordinate (Radius,Degree).polar2image:Change image from polar coordinate (Radius,Degree) to coordinate from

The Recursive Zonal Equal Area (EQ) Sphere Partitioning Toolbox is a suite of Matlab functions for partitioning and point distribution on mu
region is defined as a product of intervals in spherical polar coordinates. The center point of a region is defined via the center points of each interval, with the exception of spherical caps and their
Modified polar plot to allow for rotation/dilation of polar plot labels.
Modified version of standard POLAR plot function to allow for rotation of plot labels (not the plot itself). Also allows for redefinition of the radius labels to allow for data containing negative

GUI allows you convert spherical coordinates to UTM coordinates
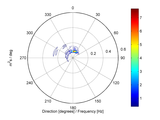
This creates a polar/contour plot for the presentation of directional data.
[px, py] = PolarContour(dirSpec, freq) creates a polar/contour plot for the presentation of directional data. This Plot was originally designed to plot directional frequency spectra from ocean

Resampling of an image with a polar sampling pattern using the built-in 'improfile' function
This function uses the built-in 'improfile' function to resample an image with a polar coordinate system.The parameters include the center and the resolution of the sampling pattern in both radial
您也可以从以下列表中选择网站:
美洲
- América Latina (Español)
- Canada (English)
- United States (English)
欧洲
- Belgium (English)
- Denmark (English)
- Deutschland (Deutsch)
- España (Español)
- Finland (English)
- France (Français)
- Ireland (English)
- Italia (Italiano)
- Luxembourg (English)
- Netherlands (English)
- Norway (English)
- Österreich (Deutsch)
- Portugal (English)
- Sweden (English)
- Switzerland
- United Kingdom (English)
亚太
- Australia (English)
- India (English)
- New Zealand (English)
- 中国
- 日本Japanese (日本語)
- 한국Korean (한국어)