6:04
Video length is 6:04
Viewing Simulation Results | Getting Started with Simulink, Part 3
From the series: Getting Started with Simulink
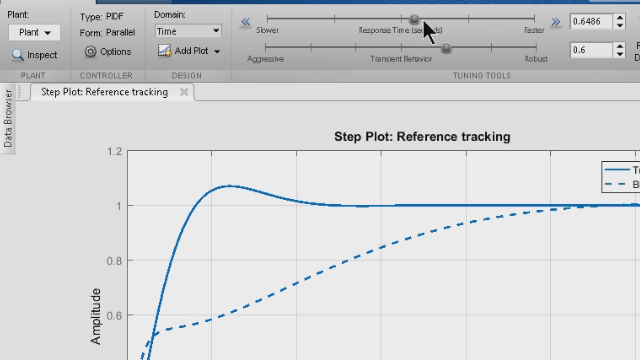
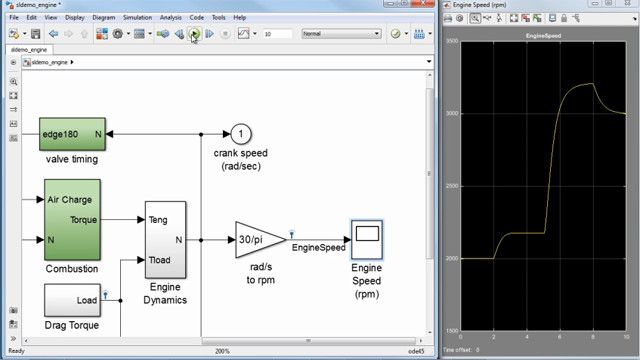
Visualize simulation results using tools such as the Simulation Data Inspector to view and compare signal data from multiple simulations, or the Dashboard Scope to see your results directly in the Simulink® editor. These tools make it easy to assess the behavior of your system after each simulation run so that you can make changes for improved system performance.
Published: 23 Oct 2017
您也可以从以下列表中选择网站:
如何获得最佳网站性能
选择中国网站(中文或英文)以获得最佳网站性能。其他 MathWorks 国家/地区网站并未针对您所在位置的访问进行优化。
美洲
- América Latina (Español)
- Canada (English)
- United States (English)
欧洲
- Belgium (English)
- Denmark (English)
- Deutschland (Deutsch)
- España (Español)
- Finland (English)
- France (Français)
- Ireland (English)
- Italia (Italiano)
- Luxembourg (English)
- Netherlands (English)
- Norway (English)
- Österreich (Deutsch)
- Portugal (English)
- Sweden (English)
- Switzerland
- United Kingdom (English)
亚太
- Australia (English)
- India (English)
- New Zealand (English)
- 中国
- 日本Japanese (日本語)
- 한국Korean (한국어)