7:00
Video length is 7:00
Stratifying Data for Visualization in SimBiology | SimBiology Tutorials for QSP, PBPK, and PK/PD Modeling and Analysis
From the series: SimBiology Tutorials for QSP, PBPK, and PK/PD Modeling and Analysis
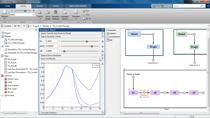
With the interactive Model Analyzer app, you can easily visualize experimental data and simulation results. In this video, you will see how to stratify data to visualize different model quantities and experimental data sets in multiple plots.
您也可以从以下列表中选择网站:
如何获得最佳网站性能
选择中国网站(中文或英文)以获得最佳网站性能。其他 MathWorks 国家/地区网站并未针对您所在位置的访问进行优化。
美洲
- América Latina (Español)
- Canada (English)
- United States (English)
欧洲
- Belgium (English)
- Denmark (English)
- Deutschland (Deutsch)
- España (Español)
- Finland (English)
- France (Français)
- Ireland (English)
- Italia (Italiano)
- Luxembourg (English)
- Netherlands (English)
- Norway (English)
- Österreich (Deutsch)
- Portugal (English)
- Sweden (English)
- Switzerland
- United Kingdom (English)
亚太
- Australia (English)
- India (English)
- New Zealand (English)
- 中国
- 日本Japanese (日本語)
- 한국Korean (한국어)