Evaluate and Inspect Results of Semantic Segmentation
Import a test data set, run a pretrained semantic segmentation network, and evaluate and inspect semantic segmentation quality metrics for the predicted results.
Import a Data Set
The triangleImages data set has 100 test images with ground truth labels. Define the location of the data set.
dataSetDir = fullfile(toolboxdir("vision"),"visiondata","triangleImages");
Define the location of the test images.
testImagesDir = fullfile(dataSetDir,"testImages");Create an imageDatastore object holding the test images.
imds = imageDatastore(testImagesDir);
Define the location of the ground truth labels.
testLabelsDir = fullfile(dataSetDir,"testLabels");Define the class names and their associated label IDs. The label IDs are the pixel values used in the image files to represent each class.
classNames = ["triangle" "background"];
labelIDs = [255 0];
Create a pixelLabelDatastore object holding the ground truth pixel labels for the test images.
pxdsTruth = pixelLabelDatastore(testLabelsDir,classNames,labelIDs);
Run a Semantic Segmentation Classifier
Load a semantic segmentation network that has been trained on the training images of triangleImages.
net = load("triangleSegmentationNetwork.mat");
net = net.net;
Run the network on the test images. Predicted labels are written to disk in a temporary directory and returned as a pixelLabelDatastore object.
pxdsResults = semanticseg(imds,net,Classes=classNames,WriteLocation=tempdir);
Running semantic segmentation network
-------------------------------------
* Processed 100 images.
Evaluate the Quality of the Prediction
The predicted labels are compared to the ground truth labels. While the semantic segmentation metrics are being computed, progress is printed to the Command Window.
metrics = evaluateSemanticSegmentation(pxdsResults,pxdsTruth);
Evaluating semantic segmentation results
----------------------------------------
* Selected metrics: global accuracy, class accuracy, IoU, weighted IoU, BF score.
* Processed 100 images.
* Finalizing... Done.
* Data set metrics:

    GlobalAccuracy    MeanAccuracy    MeanIoU    WeightedIoU    MeanBFScore
    ______________    ____________    _______    ___________    ___________

       0.99074          0.99183       0.91118      0.98299        0.80563
Inspect Class Metrics
Display the classification accuracy, the intersection over union (IoU), and the boundary F-1 score for each class in the data set.
metrics.ClassMetrics
ans=2×3 table
                  Accuracy      IoU      MeanBFScore
                  ________    _______    ___________

    triangle      0.99302     0.83206      0.67208
    background    0.99063      0.9903      0.93918
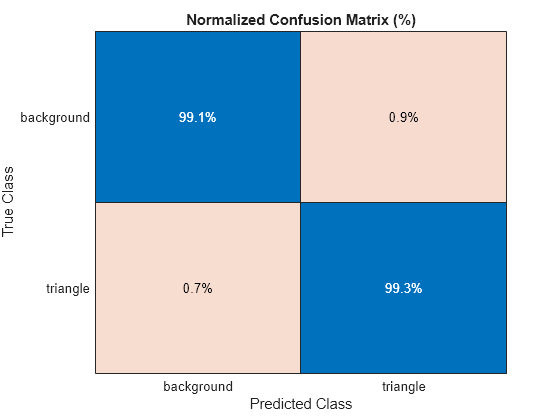
Display the Confusion Matrix
Display the confusion matrix.
metrics.ConfusionMatrix
ans=2×2 table
                  triangle    background
                  ________    __________

    triangle        4697           33
    background       915        96755
Visualize the normalized confusion matrix as a confusion chart in a figure window.
cm = confusionchart(metrics.ConfusionMatrix.Variables, ...
  classNames,Normalization="row-normalized");
cm.Title = "Normalized Confusion Matrix (%)";
Inspect an Image Metric
Visualize the histogram of the per-image intersection over union (IoU).
imageIoU = metrics.ImageMetrics.MeanIoU;
figure
histogram(imageIoU)
title("Image Mean IoU")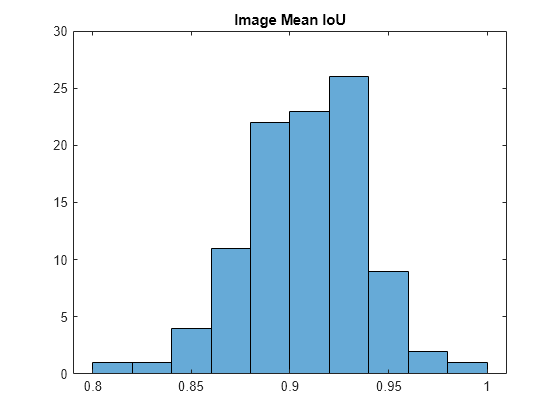
Find the test image with the lowest IoU.
[minIoU, worstImageIndex] = min(imageIoU);
minIoU = minIoU(1);
worstImageIndex = worstImageIndex(1);
Read the test image with the worst IoU, its ground truth labels, and its predicted labels for comparison.
worstTestImage = readimage(imds,worstImageIndex);
worstTrueLabels = readimage(pxdsTruth,worstImageIndex);
worstPredictedLabels = readimage(pxdsResults,worstImageIndex);
Convert the label images to images that can be displayed in a figure window.
worstTrueLabelImage = im2uint8(worstTrueLabels == classNames(1));
worstPredictedLabelImage = im2uint8(worstPredictedLabels == classNames(1));
Display the worst test image, the ground truth, and the prediction.
worstMontage = cat(4,worstTestImage,worstTrueLabelImage,worstPredictedLabelImage);
worstMontage = imresize(worstMontage,4,"nearest");
figure
montage(worstMontage,Size=[1 3])
title("Test Image vs. Truth vs. Prediction. IoU = "+minIoU)

Similarly, find the test image with the highest IoU.
[maxIoU, bestImageIndex] = max(imageIoU);
maxIoU = maxIoU(1);
bestImageIndex = bestImageIndex(1);
Repeat the previous steps to read, convert, and display the test image with the best IoU with its ground truth and predicted labels.
bestTestImage = readimage(imds,bestImageIndex);
bestTrueLabels = readimage(pxdsTruth,bestImageIndex);
bestPredictedLabels = readimage(pxdsResults,bestImageIndex);

bestTrueLabelImage = im2uint8(bestTrueLabels == classNames(1));
bestPredictedLabelImage = im2uint8(bestPredictedLabels == classNames(1));

bestMontage = cat(4,bestTestImage,bestTrueLabelImage,bestPredictedLabelImage);
bestMontage = imresize(bestMontage,4,"nearest");
figure
montage(bestMontage,Size=[1 3])
title("Test Image vs. Truth vs. Prediction. IoU = "+maxIoU)

Specify Metrics to Evaluate
Optionally, list the metric(s) you would like to evaluate using the Metrics name-value argument.
Define the metrics to compute.
evaluationMetrics = ["accuracy" "iou"];
Compute these metrics for the triangleImages test data set.
metrics = evaluateSemanticSegmentation(pxdsResults,pxdsTruth,Metrics=evaluationMetrics);
Evaluating semantic segmentation results
----------------------------------------
* Selected metrics: class accuracy, IoU.
* Processed 100 images.
* Finalizing... Done.
* Data set metrics:

    MeanAccuracy    MeanIoU
    ____________    _______

      0.99183       0.91118
Display the chosen metrics for each class.
metrics.ClassMetrics
ans=2×2 table
                  Accuracy      IoU
                  ________    _______

    triangle      0.99302     0.83206
    background    0.99063      0.9903
See Also
semanticseg | semanticSegmentationMetrics | evaluateSemanticSegmentation
Related Topics
You can also select a web site from the following list:
Americas
- América Latina (Español)
- Canada (English)
- United States (English)
Europe
- Belgium (English)
- Denmark (English)
- Deutschland (Deutsch)
- España (Español)
- Finland (English)
- France (Français)
- Ireland (English)
- Italia (Italiano)
- Luxembourg (English)
- Netherlands (English)
- Norway (English)
- Österreich (Deutsch)
- Portugal (English)
- Sweden (English)
- Switzerland
- United Kingdom (English)