Mixed-Signal Analyzer part 3: Custom analysis functions
From the series: Mixed-Signal Data Analysis with MATLAB
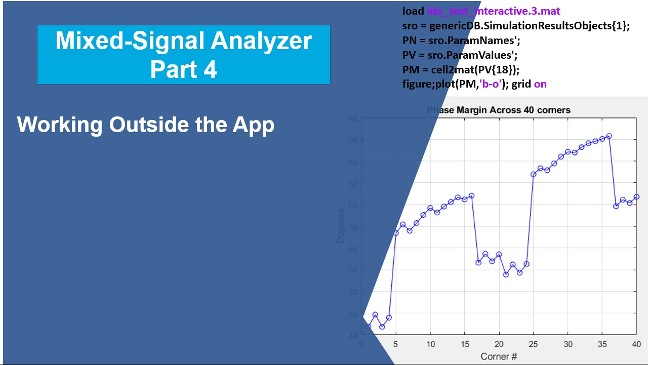
This video on Mixed-Signal Analyzer shows how to write custom analysis functions and integrate them into the app. We use data from a clock buffer Cadence simulation and write a custom MATLAB function to compute a transient signal’s power spectrum. This analysis function becomes an integral part of Mixed-Signal Analyzer no different from the built-in analyses. The approach is based on modifying a pre-populated template function that the user customizes with their own MATLAB and certain parameters describing how the data should be displayed, e.g. log vs linear axes scaling.
Published: 12 Feb 2024
Select a Web Site
Choose a web site to get translated content where available and see local events and offers. Based on your location, we recommend that you select: .
You can also select a web site from the following list
How to Get Best Site Performance
Select the China site (in Chinese or English) for best site performance. Other MathWorks country sites are not optimized for visits from your location.
Americas
- América Latina (Español)
- Canada (English)
- United States (English)
Europe
- Belgium (English)
- Denmark (English)
- Deutschland (Deutsch)
- España (Español)
- Finland (English)
- France (Français)
- Ireland (English)
- Italia (Italiano)
- Luxembourg (English)
- Netherlands (English)
- Norway (English)
- Österreich (Deutsch)
- Portugal (English)
- Sweden (English)
- Switzerland
- United Kingdom (English)
Asia Pacific
- Australia (English)
- India (English)
- New Zealand (English)
- 中国
- 日本Japanese (日本語)
- 한국Korean (한국어)