Ambient IoT R2D Block Error Rate Simulation
R2026bThis example shows how to simulate an Ambient Internet-of-Things (A-IoT) reader-to-device (R2D) link and measure the block error rate (BLER) using 5G Toolbox™ features.
Introduction
Release 19 of the 3GPP NR standard introduced A-IoT to address the need for large-scale deployments of low-power or batteryless devices. These devices have ultra-low complexity and are powered by energy harvested from ambient sources in the environment. Due to these restrictions, a device must be able to receive and decode an R2D waveform using simple signal processing techniques, such as envelope detection and thresholding.
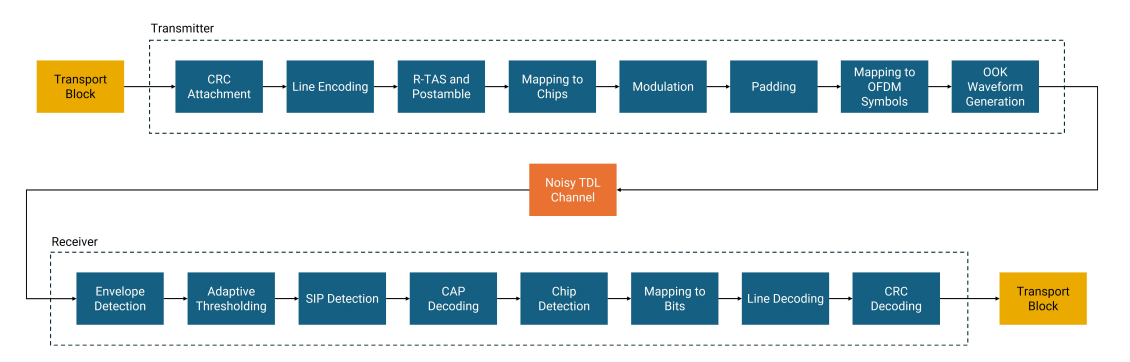
This example measures the BLER of an A-IoT R2D link. The example models the following stages of R2D transmission, as defined in TS 38.291 Section 6.2:
Physical reader-to-device channel (PRDCH) encoding:
Cyclic redundancy check (CRC) attachment
Line encoding
R2D timing acquisition signal (R-TAS) and postamble insertion
Mapping from bits to chips
Modulation
Padding
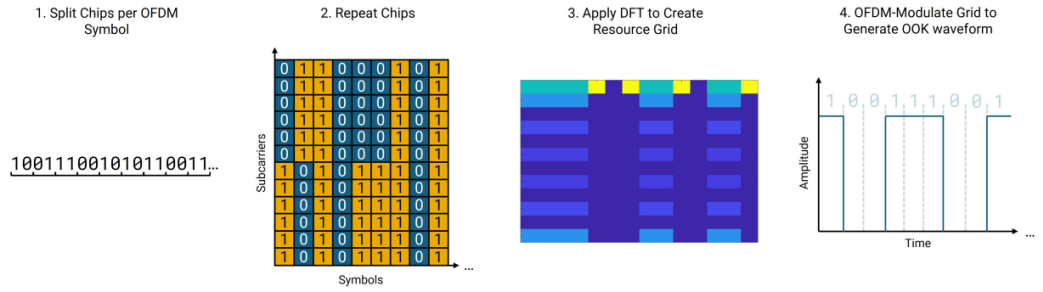
As there is no specified relationship between the encoded chips and the OFDM symbols, on-off keying (OOK) waveform generation is performed with the following steps:
1. Split input chips based on chips per symbol.
2. Repeat the chips assigned to each OFDM symbol up to the total number of subcarriers.
3. Take the Discrete Fourier Transform (DFT) of the chips assigned to each symbol to create the OFDM resource grid.
4. OFDM modulate the resource grid to generate the OOK waveform representing the input chips.
The example then passes the generated waveform through a tapped delay line (TDL) channel and adds noise. The example assumes perfect timing synchronization. The waveform is then received and decoded, performing the following steps to reconstruct the data:
Envelope detection
Adaptive thresholding
Start indicator part (SIP) detection
Clock acquisition part (CAP) decoding
Chip detection
Mapping from chips to bits
PRDCH decoding:
Line decoding
CRC detachment
Simulation Length and SNR Points
Set the length of the simulation in terms of the number of transport blocks sent through the link per SNR point and the number of SNR points to simulate. The SNR is defined per resource element (RE) and applies to each receive antenna. For an explanation of the SNR definition that this example uses, see SNR Definition Used in Link Simulations.
numTransportBlocks = 100;
snrRange = -10:5:25;
R2D Configuration
Set the bandwidth in resource blocks (RBs). Each RB contains 12 subcarriers. A-IoT R2D only supports 15 kHz subcarrier spacing.
nSizeGrid = 50;
Set the number of chips per symbol, which defines the amount of information encoded in each OFDM symbol.
chipsPerSymbol =  6;
6;Set the size of each individual transport block in bits. The number of bits must be less than 1000.
transportBlockSize = 200; % bitsPropagation Channel Model Configuration
Create a TDL channel model and set the number of device receive antennas to 1.
channel = nrTDLChannel;
channel.NumReceiveAntennas = 1;
% A-IoT R2D only supports 15 kHz subcarrier spacing and requires 2048 FFT points.
SCS = 15;
Nfft = 2048;
info = nrOFDMInfo(nSizeGrid,SCS,Nfft=Nfft);
channel.SampleRate = info.SampleRate;
Set the random number generation for reproducible results.
rng("default")Processing Loop
The hR2D helper object and associated object functions implement the A-IoT R2D transmit processing chain and basic device functionality to extract the chips from a received waveform and decode the PRDCH.
To determine the BLER at each SNR point, the example loops over each transport block and performs the following steps:
CRC attachment and line encoding: Attach CRC parity bits to the transport block bits. Encode the CRC-encoded bits using Manchester line encoding.
R-TAS and postamble insertion: Prepend SIP and CAP to the encoded bits. Append the R2D postamble to the encoded bits.
Mapping bits to chips: Map the bits to chips and append padding chips.
On–off keyed (OOK) waveform generation: Repeat the chips across the subcarriers of the OFDM resource grid, based on the number of chips per symbol. Take the DFT to create the OFDM resource grid. Use the
nrOFDMModulatefunction to perform OFDM modulation on the resource grid and generate a time-domain OOK waveform.Channel modeling: Pass the generated waveform through a TDL fading channel to get the faded waveform. Then, apply additive white Gaussian noise (AWGN) to the faded waveform. The SNR for each layer is defined per RE and per receive antenna. For an explanation of the SNR definition that this example uses, see SNR Definition Used in Link Simulations.
Reception and decoding: The example assumes a device that uses an adaptive threshold to determine the value of the received chips. Decode the SIP to determine the location of transmitted chips in the waveform and then decode the CAP to determine the number of chips per symbol. Recover and decode the PRDCH chips, and record the number of instances of incorrect decoding.
R2D = hR2D; % Create an hR2D object
BLER = [];
for SNRdB = snrRange
    tbErr = 0;
    for nTB = 1:numTransportBlocks
        % Generate transport block
        transportBlock = randi([0 1],transportBlockSize,1,"int8");

        % Perform CRC attachment and line encoding to generate PRDCH bits
        prdchBits = PRDCH(R2D,transportBlock);

        % Insert the R-TAS and postamble
        bits = addRTAS(R2D,prdchBits);
        bits = addPostamble(R2D,bits);

        % Map the bits to chips
        chips = mapToChips(R2D,bits,chipsPerSymbol);

        % Map the chips to subcarriers and symbols, and OFDM modulate the grid
        % to create an OOK waveform.
        rgrid = mapToResourceGrid(R2D,chips,chipsPerSymbol,nSizeGrid);
        waveform = nrOFDMModulate(rgrid,SCS,0,Nfft=Nfft);

        % Pass through the channel
        [rxWaveform,pathGains] = channel(waveform);

        % Add noise
        SNR = 10^(SNRdB/10);
        N0 = 1/sqrt(info.Nfft*SNR);
        noise = N0*randn(size(rxWaveform),"like",rxWaveform);
        rxWaveform = rxWaveform + noise;

        % Use perfect timing estimation to get offset caused by the channel
        offset = nrPerfectTimingEstimate(pathGains,getPathFilters(channel));

        % Receive the waveform and recover chips using an adaptive threshold
        rxChips = recoverChips(R2D,rxWaveform,info.SampleRate,offset);

        if ~isempty(rxChips)
            % Map chips to bits
            rxBits = mapToBits(R2D,rxChips,chipsPerSymbol);
            % Strip R-TAS
            rxPRDCHBits = rxBits(13:end);
            % Decode PRDCH
            [rxTransportBlock,err] = PRDCHDecode(R2D,rxPRDCHBits,transportBlockSize);
            tbErr = tbErr + double(err>0);
        else
            tbErr = tbErr + 1;
        end

        % Reinitialize channel with a new seed
        release(channel);
        reset(channel);
        channel.Seed = randi([1 numTransportBlocks]);
    end

    BLER = [BLER tbErr/numTransportBlocks];
    fprintf("BLER for %d transport block(s) with %d chips per symbol at SNR %d dB: %3.2f\r\n",numTransportBlocks,chipsPerSymbol,SNRdB,BLER(end));
    rng("default") % Reset RNG for consistency across SNR points
end
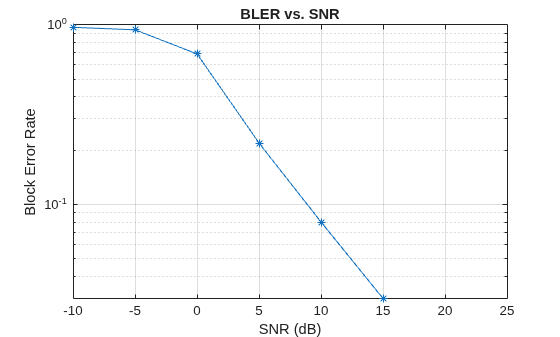
BLER for 100 transport block(s) with 6 chips per symbol at SNR -10 dB: 0.97
BLER for 100 transport block(s) with 6 chips per symbol at SNR -5 dB: 0.94
BLER for 100 transport block(s) with 6 chips per symbol at SNR 0 dB: 0.69
BLER for 100 transport block(s) with 6 chips per symbol at SNR 5 dB: 0.22
BLER for 100 transport block(s) with 6 chips per symbol at SNR 10 dB: 0.08
BLER for 100 transport block(s) with 6 chips per symbol at SNR 15 dB: 0.03
BLER for 100 transport block(s) with 6 chips per symbol at SNR 20 dB: 0.00
BLER for 100 transport block(s) with 6 chips per symbol at SNR 25 dB: 0.00
BLER Results
Plot the calculated BLER against the SNR to visualize the link performance.
semilogy(snrRange,BLER,"-*");
grid on
title("BLER vs. SNR");
xlabel("SNR (dB)");
ylabel("Block Error Rate");
xlim([min(snrRange),max(snrRange)]);
Further Exploration
To observe the BLER for different R2D configurations, try changing chipsPerSymbol and transportBlockSize.
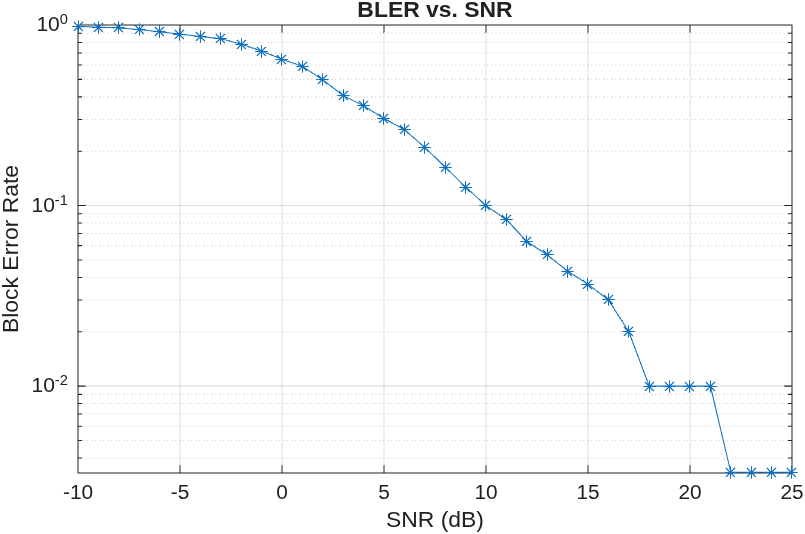
For meaningful BLER results, use a large number of transport blocks and increase the SNR range. For example, this plot shows BLER results for 300 transport blocks of 1000 bits each, with 6 chips per symbol, over an SNR range of -10 dB to 25 dB.