NR Intercell Interference Modeling
This example shows how to simulate a multicell interference scenario and measure the impact on network performance due to downlink (DL) intercell interference caused by nearby cells. The example models a 5G New Radio (NR) network of multiple cells operating in the same frequency band. Each cell has a gNodeB (gNB) that serves a set of user equipment (UE) nodes. The NR stack on the nodes includes radio link control (RLC), medium access control (MAC), and physical layers (PHY).
Introduction
This example models:
Co-channel intercell interference.
Slot-based round robin scheduling of physical downlink shared channel (PDSCH) resources.
3GPP TR 38.901 channel model.
Single input single output (SISO) antenna configuration.
Link-to-system-mapping-based abstract PHY.
In this example, you consider the control packets, such as DL assignments, PDSCH feedback, and channel quality indicator (CQI) report, transmitted as out-of-band. Out-of-band refers to the transmission without the need for resources. It also refers to assured error-free reception.
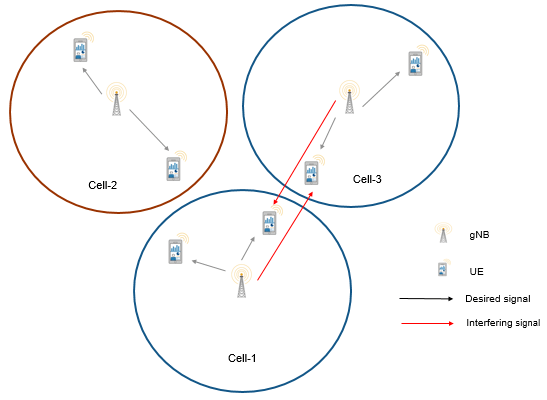
Co-Channel Interference
Co-channel cells are the NR cells operating on the same frequency. They can interfere with each other.
Consider this sample network topology consisting of 3 cells. Cell-1 and Cell-3 operate on the same frequency band. Cell-2 operates on a different frequency band and does not interfere with Cell-1 or Cell-3.
Scenario setup
Create a wireless network simulator.
rng("default") % Reset the random number generator numFrameSimulation =20; % Simulation time in terms of number of 10 ms frames networkSimulator = wirelessNetworkSimulator.init;
Specify the positions of 3 gNBs and the gNB of interest for visualizing metrics.
gNBPositions = [1700 600 30; 3000 600 30; 2500 2000 30]; gNBOfInterestIdx =3; % Specify an integer value in the range [1, number of gNBs]
Create the gNB nodes by specifying their name, position, carrier frequency, channel bandwidth, subcarrier spacing, transmit power, and receive gain. Set the sounding reference signal (SRS) transmission periodicity to 5 slots for all UEs connecting to each gNB. Each gNB operates one NR cell.
gNBNames = "gNB-" + (1:size(gNBPositions,1));
gNBs = nrGNB(Name=gNBNames,Position=gNBPositions,CarrierFrequency=2.5e9, ...
    ChannelBandwidth=10e6,SubcarrierSpacing=30e3,TransmitPower=32, ...
    ReceiveGain=11,SRSPeriodicityUE=5);
Set the scheduler parameter ResourceAllocationType by using the configureScheduler function.
for gNBIdx = 1:numel(gNBs)
    % Resource allocation type value 0 indicates a noncontiguous allocation of
    % frequency-domain resources in terms of RBGs
    configureScheduler(gNBs(gNBIdx),ResourceAllocationType=0)
end
Generate the positions of UE nodes in each cell.
numCells = numel(gNBs); cellRadius =500; % Radius of each cell (in meters) numUEsPerCell =
4; uePositions = generateUEPositions(cellRadius,gNBPositions,numUEsPerCell);
Create UE nodes and connect them to a gNB. Set the DL channel status information (CSI) report periodicity to 10 slots and configure full buffer traffic in the DL direction.
UEs = cell(numCells,1);
for cellIdx = 1:numCells
    ueNames = "UE-" + (1:size(uePositions{cellIdx},1));
    if cellIdx ~= gNBOfInterestIdx
        ueNames = "InterferingCell-" + cellIdx + "-" + ueNames;
    end
    UEs{cellIdx} = nrUE(Name=ueNames,Position=uePositions{cellIdx},ReceiveGain=11);
    connectUE(gNBs(cellIdx),UEs{cellIdx},CSIReportPeriodicity=10, ...
        FullBufferTraffic="DL")
end
Add gNBs and UEs to the network simulator.
addNodes(networkSimulator,gNBs);
for cellIdx = 1:numCells
    addNodes(networkSimulator,UEs{cellIdx})
end
Use 3GPP TR 38.901 channel model for all links. You can also run the example with an free space path loss (FSPL) model.
channelModel ="3GPP TR 38.901"; if strcmp(channelModel,"3GPP TR 38.901") % Define scenario boundaries pos = [reshape([gNBs.Position],3,[])]; % X-coordinate of the left edge of the scenario in meters minX = min(pos(1,:)); % Y-coordinate of the bottom edge of the scenario in meters minY = min(pos(2,:)); % Width (right edge of the 2D scenario) in meters, given as maxX - minX width = max(pos(1,:)) - minX; % Height (top edge of the 2D scenario) in meters, given as maxY - minY height = max(pos(2,:)) - minY; % Create the channel model channel = h38901Channel(Scenario="UMa",ScenarioExtents=[minX minY width height]); % Add the channel model to the simulator addChannelModel(networkSimulator,@channel.channelFunction); connectNodes(channel,networkSimulator,InterfererHasSmallScale=true); end
Get the cell ID for the gNB of interest. The visualizations and metrics displayed are for this cell.
cellToAnalyze = gNBs(gNBOfInterestIdx).ID;
Set the enableTraces as true to log the traces. When you set the enableTraces parameter to false, the simulation does not log any traces. However, setting enableTraces to false can speed up the simulation.
enableTraces =  true;
true;Create objects to log MAC and PHY traces.
linkDir = "DL"; % Indicates DL
if enableTraces
    simSchedulingLogger = cell(numCells,1);
    simPhyLogger = cell(numCells,1);

    for cellIdx = 1:numCells
        % Create an object for MAC DL scheduling traces logging
        simSchedulingLogger{cellIdx} = ...
            helperNRSchedulingLogger(numFrameSimulation, ...
            gNBs(cellToAnalyze),UEs{cellToAnalyze},LinkDirection=linkDir);

        % Create an object for PHY layer traces logging
        simPhyLogger{cellIdx} = helperNRPhyLogger(numFrameSimulation, ...
            gNBs(cellToAnalyze),UEs{cellToAnalyze});
    end
end
Set the number of updates per second for the metric plots.
numMetricPlotUpdates =100; % Updates plots every 10 milliseconds
Create an object for MAC and PHY metrics visualization.
showSchedulerMetrics =true; showPhyMetrics =
true; metricsVisualizer = helperNRMetricsVisualizer(gNBs(cellToAnalyze), ... UEs{cellToAnalyze},CellOfInterest=cellToAnalyze, ... RefreshRate=numMetricPlotUpdates,PlotSchedulerMetrics=showSchedulerMetrics, ... PlotPhyMetrics=showPhyMetrics,LinkDirection=linkDir);
Write the logs to MAT-files. You can use these logs for post-simulation analysis.
if enableTraces
    simulationLogFile = "simulationLogs"; % For logging the simulation traces
end
Add a mobility model to the UE node of interest within the desired cell. You can use either the random waypoint mobility model or a trace-based mobility model.
enableMobility =false; if enableMobility mobilityModel =
"RandomWaypoint"; ueWithMobility = UEs{cellToAnalyze}(2); % Get UE-2 in the cell of interest refreshIntervalInSec = 0.1; % How often the node updates its position and velocity information, with a single refresh occurring at each fixed interval if strcmp(mobilityModel,"RandomWaypoint") ueSpeedRange = [1 1000]; % In meters per second % Add random waypoint mobility to the selected UE addMobility(ueWithMobility,SpeedRange=ueSpeedRange,BoundaryShape="circle", ... Bounds=[gNBs(cellToAnalyze).Position(1:2) cellRadius],RefreshInterval=refreshIntervalInSec); else % Add trace-based mobility to the selected UE traceMobilityModel = hNodeMobilityTraceBased("MobilityTrace.mat"); % "MobilityTrace.mat" is the trace file name addMobility(ueWithMobility,MobilityModel=traceMobilityModel); end end
Display the network topology.
networkVisualizer = wirelessNetworkViewer(ShowNodeNames=false);
addNodes(networkVisualizer,gNBs)
addNodes(networkVisualizer,[UEs{:}])
% Show the cell boundary of each gNB
showBoundary(networkVisualizer,Position=gNBPositions,BoundaryShape="circle", ...
    Bounds=cellRadius)
Run the simulation for the specified numFrameSimulation frames.
% Calculate the simulation duration (in seconds)
simulationTime = numFrameSimulation*1e-2;
% Run the simulation
run(networkSimulator,simulationTime);
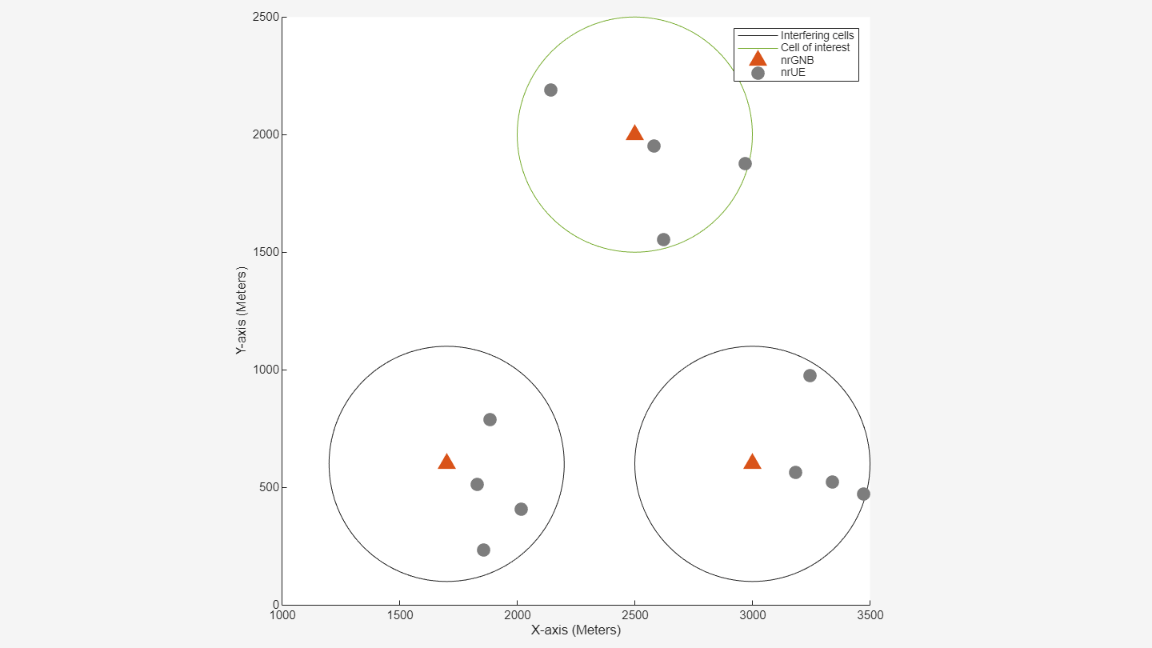
This figure depicts the configured cellular topology. Within each cell, the figure shows the locations of the gNB and the connected UE nodes.
Read per-node statistics.
gNBStats = statistics(gNBs);
ueStats = cell(numCells, 1);
for cellIdx = 1:numCells
    ueStats{cellIdx} = statistics(UEs{cellIdx});
end
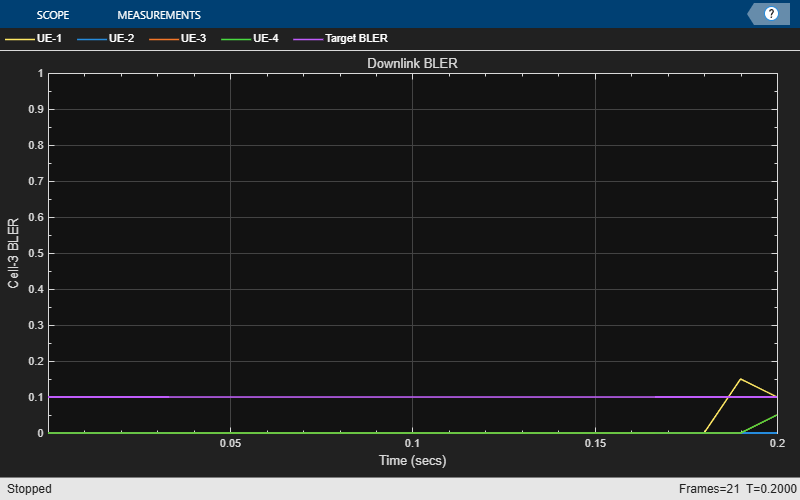
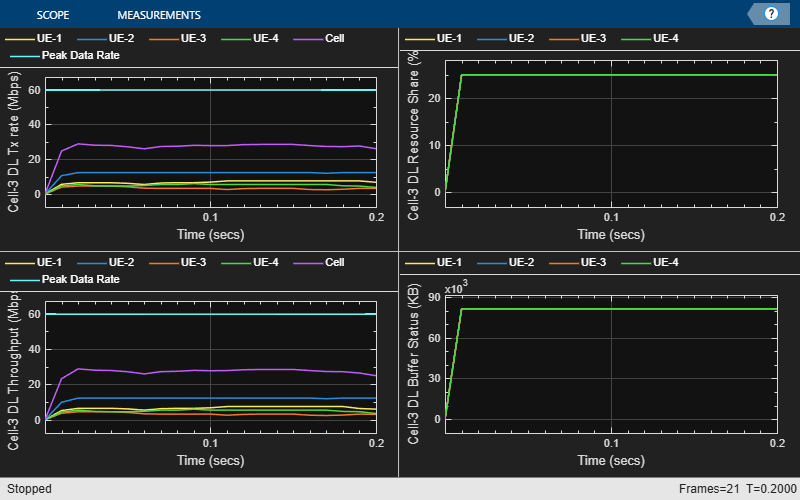
At the end of the simulation, compare the achieved values for system performance indicators with theoretical peak values (considering zero overheads). Performance indicators displayed are achieved data rate (DL), achieved spectral efficiency (DL), and BLER observed for UEs (DL). The calculated peak values are in accordance with 3GPP TR 37.910. In the specified cell of interest, UE-1, UE-3, and UE-4 are almost equidistant from their gNB. However, you can observe lower throughput for UE-3 and UE-4 as compared to UE-1. This is because UE-3 and UE-4 experience higher intercell interference.
displayPerformanceIndicators(metricsVisualizer)
Peak DL throughput: 59.72 Mbps
Achieved cell DL throughput: 27.34 Mbps
Achieved DL throughput for each UE: [6.74        12.15         3.35          5.1]
Peak DL spectral efficiency: 5.97 bits/s/Hz
Achieved DL spectral efficiency for cell: 2.73 bits/s/Hz
Block error rate for each UE in the DL direction: [0.013           0       0.003       0.003]
Simulation Visualization
To evaluate the performance of the configured cell, the example includes various runtime visualizations. For further details on the runtime visualizations presented, refer to Simulation Visualizations.
Simulation Logs
This example stores the simulation logs in MAT-files for analysis and visualization after the simulation. The simulation captures the per-time-step logs, the scheduling assignment logs, and the PHY reception logs for each cell and saves them in the MAT-file 'simulationLogFile'. After the simulation, open the file to load NCellID, DLTimeStepLogs, SchedulingAssignmentLogs, and PhyReceptionLogs in the workspace.
NCellID: This stores the cell ID, representing the cell to which the simulation logs belong.
DL time step logs: This stores the per slot logs of the simulation with each slot as one row in the simulation. For more information about log format, see the 'Time step logs' section of the NR Cell Performance Evaluation with MIMO example.
Scheduling assignment logs: This file logs the Information of all the scheduling assignments and related information.For more information about log format, see the 'Scheduling assignment logs' section in the NR Cell Performance Evaluation with MIMO example.
Phy reception logs: This file logs the packet reception information observed in the simulation. For more information about log format, see the 'Phy reception logs' section in the NR Cell Performance Evaluation with MIMO example.
if enableTraces
    % Obtain the logs
    simulationLogs = cell(numCells, 1);
    for cellIdx = 1:numCells
        if gNBs(cellIdx).DuplexMode == "FDD"
            logInfo = struct(NCellID=[],DLTimeStepLogs=[], ...
                SchedulingAssignmentLogs=[],PhyReceptionLogs=[]);
            logInfo.DLTimeStepLogs = getSchedulingLogs(simSchedulingLogger{cellIdx});
        else % TDD
            logInfo = struct(NCellID=[],TimeStepLogs=[], ...
                SchedulingAssignmentLogs=[],PhyReceptionLogs=[]);
            logInfo.TimeStepLogs = getSchedulingLogs(simSchedulingLogger{cellIdx});
        end
        logInfo.NCellID = gNBs(cellIdx).ID;
        % Obtain the scheduling assignments log
        logInfo.SchedulingAssignmentLogs = getGrantLogs(simSchedulingLogger{cellIdx});
        % Obtain the Phy reception logs
        logInfo.PhyReceptionLogs = getReceptionLogs(simPhyLogger{cellIdx});
        simulationLogs{cellIdx} = logInfo;
    end
    % Save simulation logs in a MAT-file
    save(simulationLogFile,"simulationLogs")
end
Further Exploration
You can use this example to further explore these options:
Model the uplink interference between the nodes by specifying the uplink-related configuration parameters. For more information about this, see the NR Cell Performance Evaluation with MIMO example.
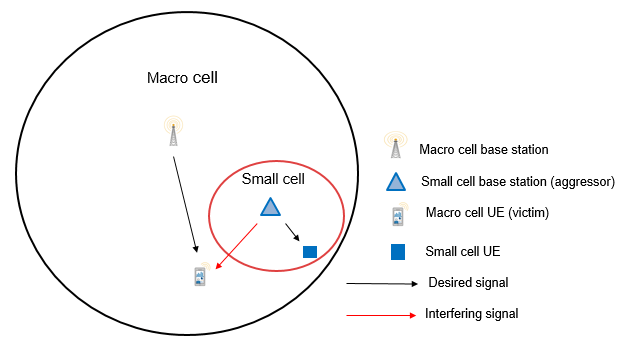
Model the Aggressor-Victim scenarios: The aggressor is the source of interference and the victim suffers due to the interference. Consider the DL scenario in this figure. The macro cell UE is far away from the macro base station (BS) and near to the small cell. In DL direction, macro cell UE suffers from interference by the small cell BS. The small cell BS is called the aggressor and macro UE is called the victim.
Model multiple clusters, where each cluster consists of cells operating on different frequencies, and analyze the impact of interference on the cell edge users.
Model the effects of intra-cell mobility on the downlink metrics: The mobility model installed on the UE determines the pattern along which the UE moves within a particular cell. Set the
enableMobilityto true for enabling mobility on UE-2 in theCellToAnalyze. This plot demonstrates the effect of UE mobility on the throughput for a simulation duration of 1000 frames. The throughput decreases gradually as the UE moves away from the gNB. However, in comparison, the static UE nodes sustain their data rates throughout the simulation.
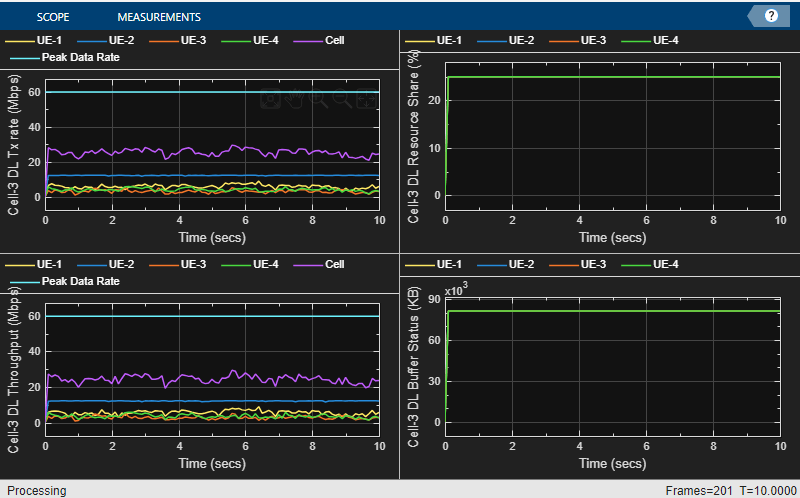
Throughput plots for the cell of interest with static UEs
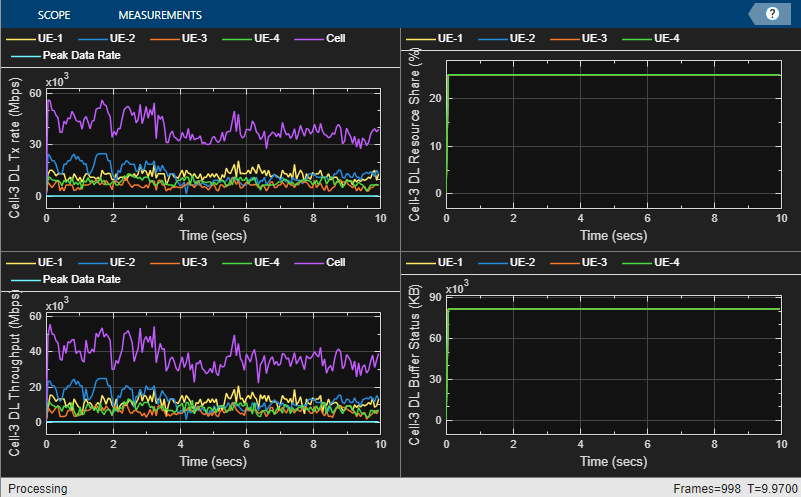
Throughput plots for the cell of interest with mobility installed on UE-2
Local functions
function uePositions = generateUEPositions(cellRadius,gNBPositions,numUEsPerCell)
%generateUEPositions Return the position of UE nodes in each cell

numCells = size(gNBPositions,1);
uePositions = cell(numCells,1);
ueHeight = 3; % In meters
for cellIdx=1:numCells
    gnbXCo = gNBPositions(cellIdx,1); % gNB X-coordinate
    gnbYCo = gNBPositions(cellIdx,2); % gNB Y-coordinate
    theta = rand(numUEsPerCell,1)*(2*pi);
    % Use these expressions to calculate the position of UE nodes within the cell. By default,
    % the placement of the UE nodes is random within the cell
    r = sqrt(rand(numUEsPerCell,1))*cellRadius;
    x = round(gnbXCo + r.*cos(theta));
    y = round(gnbYCo + r.*sin(theta));
    z = ones(numUEsPerCell,1) * ueHeight;
    uePositions{cellIdx} = [x y z];
end
end
Supporting Functions
The example uses these helpers:
helperNRMetricsVisualizer:Implements metrics visualization functionalityhelperNRSchedulingLogger: Implements scheduling information logging functionalityhelperNRPhyLogger:Implements PHY packet reception information logging functionalityh38901Channel:Implements the 3GPP TR 38.901 channel modelhNRKPIManager: Implements functionality for calculating key performance indicatorshNodeMobilityTraceBased: Implements trace-based mobility model functionality
References
[1] 3GPP TS 38.104. “NR; Base Station (BS) radio transmission and reception.” 3rd Generation Partnership Project; Technical Specification Group Radio Access Network.
[2] 3GPP TS 38.214. “NR; Physical layer procedures for data.” 3rd Generation Partnership Project; Technical Specification Group Radio Access Network.
[3] 3GPP TS 38.321. “NR; Medium Access Control (MAC) protocol specification.” 3rd Generation Partnership Project; Technical Specification Group Radio Access Network.
[4] 3GPP TS 38.322. “NR; Radio Link Control (RLC) protocol specification.” 3rd Generation Partnership Project; Technical Specification Group Radio Access Network.
[5] 3GPP TS 38.323. “NR; Packet Data Convergence Protocol (PDCP) specification.” 3rd Generation Partnership Project; Technical Specification Group Radio Access Network.
[6] 3GPP TS 38.331. “NR; Radio Resource Control (RRC) protocol specification.” 3rd Generation Partnership Project; Technical Specification Group Radio Access Network.
[7] 3GPP TR 37.910. “Study on self evaluation towards IMT-2020 submission.” 3rd Generation Partnership Project; Technical Specification Group Radio Access Network.
See Also
Objects
wirelessNetworkSimulator(Wireless Network Toolbox) |nrGNB|nrUE