Generate Trajectory Live Editor Task for Flight Mission
This example shows how to use the Generate Trajectory live task to create a flight mission trajectory.
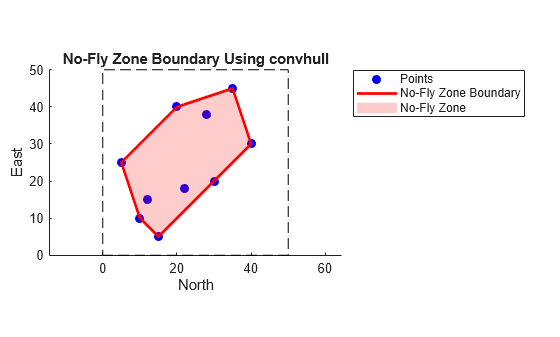
Define Boundary Area
xlim = [0 50];
ylim = [0 50];
Define a consistent set of points inside the area.
x = [10 20 35 40 30 15 5 12 28 22];
y = [10 40 45 30 20 5 25 15 38 18];
Use the convhull function to compute the convex hull indices.
hullIdx = convhull(x, y);
Plot the square area.
figure;

hold on;
rectangle('Position',[xlim(1), ylim(1), xlim(2)-xlim(1), ylim(2)-ylim(1)], ...
    'EdgeColor','k','LineStyle','--');
Plot the points.
plot(x, y, 'bo', 'MarkerFaceColor', 'b');
Plot the convex hull boundary.
plot(x(hullIdx), y(hullIdx), 'r-', 'LineWidth', 2);
Fill the no-fly zone an configure the axis settings.
fill(x(hullIdx), y(hullIdx), 'r', 'FaceAlpha', 0.2, 'EdgeColor', 'none');

% Axis settings
axis([xlim ylim]);
axis equal;
title('No-Fly Zone Boundary Using convhull');
xlabel('North');
ylabel('East');
legend('Points','No-Fly Zone Boundary','No-Fly Zone', 'Location', 'bestoutside');
hold off;
Define Path Using Generate Trajectory Live Task
On the Live Editor tab, select Insert > Task, and then select Generate Trajectory.
% Specify vehicle properties
Vehicle1.InitialPosition = [0 0];
Vehicle1.Speed = 10;
Vehicle1.InitialAltitude = 0;
Vehicle1.InitialHeading = 0;

% Generate signals for polyline trajectory

% Segment parameters
segDistances = [20, 10, 30, 20];
bearings = [0, pi/4, pi/4, pi/2];
bearingTypes = ["AbsoluteBearing", "AbsoluteBearing", "AbsoluteBearing", ...
    "AbsoluteBearing"];
altitudes = [0, 0, 0, 0];

% Initial trajectory
Vehicle1Traj = Aero.trajectory.polylineTrajectory(CoordinatePlane="Flat", ...
    InitialPosition=Vehicle1.InitialPosition, ...
    Speed=Vehicle1.Speed, ...
    InitialHeading=Vehicle1.InitialHeading, ...
    InitialAltitude=Vehicle1.InitialAltitude, ...
    OutputFormat="timeseries", ...
    Units="Metric (MKS)", ...
    StartTime="2025-12-15 10:10:12", ...
    SegmentDistance=segDistances(1), ...
    AbsoluteBearing=bearings(1), ...
    Altitude=altitudes(1));

% Add waypoints
for i = 2:numel(segDistances)
    params = struct(...
        'PriorTrajectory', Vehicle1Traj, ...
        'Speed', Vehicle1.Speed, ...
        'SegmentDistance', segDistances(i), ...
        'Altitude', altitudes(i));
    params.(bearingTypes(i)) = bearings(i);
    Vehicle1Traj = Aero.trajectory.polylineTrajectory(params);
end
clear Vehicle1 bearings bearingTypes segDistances altitudes i params
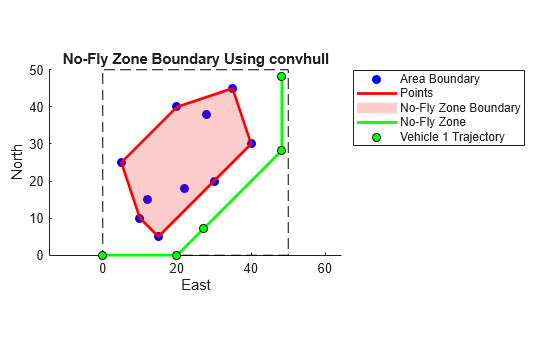
Plot Path in Map
Extract trajectory data from timeseries.
xTraj = Vehicle1Traj.xNorth.Data;
yTraj = Vehicle1Traj.yEast.Data;
Plot the square area.
figure;
Assume the axes should go from xmin to xmax and ymin to ymax.
xmin = 0; xmax = 50;
ymin = 0; ymax = 50;

hold on;
rectangle('Position',[xlim(1), ylim(1), xlim(2)-xlim(1), ylim(2)-ylim(1)], ...
    'EdgeColor','k','LineStyle','--');
Plot the points.
plot(x, y, 'bo', 'MarkerFaceColor', 'b');
Plot the convex hull boundary.
plot(x(hullIdx), y(hullIdx), 'r-', 'LineWidth', 2);
Fill the no-fly zone.
fill(x(hullIdx), y(hullIdx), 'r', 'FaceAlpha', 0.2, 'EdgeColor', 'none');
Configure axis settings.
axis([xlim ylim]);
axis equal;
title('No-Fly Zone Boundary Using convhull');
xlabel('East');
ylabel('North');
% legend('Area Boundary','Points','No-Fly Zone Boundary','No-Fly Zone');
% Plot the trajectory on the existing figure
hold on; % Keep the previous plot
plot(xTraj, yTraj, 'g-', 'LineWidth', 2);           % Plot trajectory as green line
plot(xTraj, yTraj, 'ko', 'MarkerFaceColor', 'g');   % Plot trajectory points as green dots
Add definitions to the legend.
legend('-DynamicLegend');
legend('Area Boundary','Points','No-Fly Zone Boundary','No-Fly Zone','Vehicle 1 Trajectory', 'Location', 'bestoutside');

hold off;
clearvars -except Vehicle1Traj