主要内容

plot

Visualize antenna layout and plot directivity, beamwidth, and efficiency

Since R2026a

    Description

    plot(obj) plots the reflector antenna layout.

    plot(___,Name=Value) plots the parameter specified using one or more name-value arguments.

    example

    Examples

    collapse all

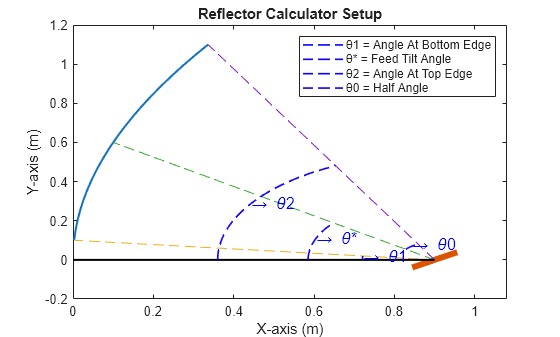
    Design a horn-fed offset parabolic reflector antenna with a diameter of 1 m, focal length 0.9 m, clearance height 0.1 m, radiator aperture 68 mm, and surface error 1 mm.

    ant = reflectorCalculator(Diameter=1,FocalLength=0.9,ClearanceHeight=0.1, ...
        RadiatorAperture=0.068,SurfaceError=1e-3);

    Visualize the antenna layout.

    figure
    plot(ant);

    Figure contains an axes object. The axes object with title Reflector Calculator Setup, xlabel X-axis (m), ylabel Y-axis (m) contains 14 objects of type line, text. These objects represent θ1 = Angle At Bottom Edge, θ* = Feed Tilt Angle, θ2 = Angle At Top Edge, θ0 = Half Angle.

    Plot the beamwidth as a function of the diameter.

    figure
    plot(ant,Frequency=12e9,Type="beamwidth");

    Figure contains an axes object. The axes object with title 3dB Beamwidth as a function of Diameter, xlabel Reflector Diameter (D/λ), ylabel 3-dB Beamwidth (°) contains 2 objects of type line. These objects represent 3-dB Beamwidth, Current BeamWidth.

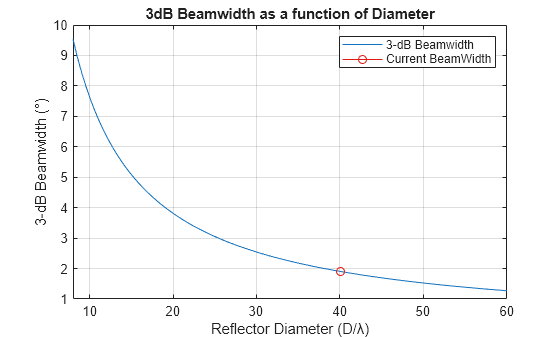
    Plot the directivity as a function of the diameter.

    figure
    plot(ant,Frequency=12e9,Type="directivity");

    Figure contains an axes object. The axes object with title Directivity as a function of Diameter, xlabel Reflector Diameter (D/λ), ylabel Directivity (dBi) contains 2 objects of type line. These objects represent Directivity, Current Directivity.

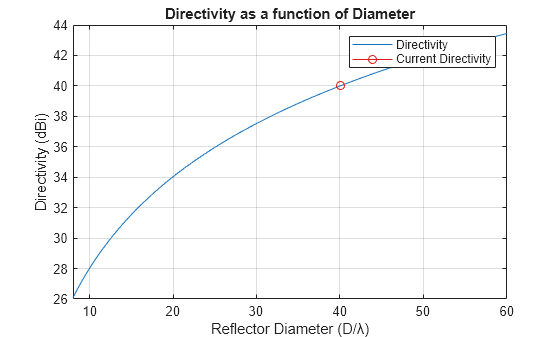
    Plot the efficiency as a function of the illumination taper.

    figure
    plot(ant,Frequency=12e9,Type="efficiency");
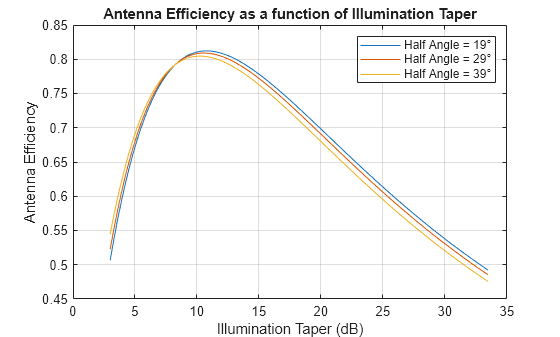
    Figure contains an axes object. The axes object with title Antenna Efficiency as a function of Illumination Taper, xlabel Illumination Taper (dB), ylabel Antenna Efficiency contains 3 objects of type line. These objects represent Half Angle = 19°, Half Angle = 29°, Half Angle = 39°.

    Input Arguments

    collapse all

    Parabolic reflector antenna, specified as a reflectorCalculator object.

    Example: reflectorCalculator

    Name-Value Arguments

    collapse all

    Specify optional pairs of arguments as Name1=Value1,...,NameN=ValueN, where Name is the argument name and Value is the corresponding value. Name-value arguments must appear after other arguments, but the order of the pairs does not matter.

    Example: Type="efficiency"

    Analysis frequency, specified as a positive scalar.

    Example: 12e9

    Data Types: double

    Type of the parameter to plot, specified as one of the following strings:

    • "layout" — Reflector antenna layout

    • "directivity" — Directivity as a function of diameter

    • "beamwidth" — Beamwidth as a function of diameter

    • "efficiency" — Efficiency as a function of illumination taper

    • "patterndata" — Directivity as a function of theta

    Example: "directivity"

    Data Types: string

    Version History

    Introduced in R2026a

    See Also

    Objects