speechTransmissionIndex
Syntax
Description
[___] = speechTransmissionIndex(___,
specifies options using one or more name-value arguments.Name=Value)
speechTransmissionIndex(___) without any output
arguments plots the uncorrected MTF and displays the STI and MTI.
Examples
Load the impulse response and sample rate from an existing audio file.
[ir,fs] = audioread("ChurchImpulseResponse-16-44p1-mono-5secs.wav");Calculate the speech transmission index (STI) using the full indirect method.
sti = speechTransmissionIndex(ir,fs)
sti =
0.4792
Simulate the impulse response of a room using acousticRoomResponse.
fs = 48e3;
roomDimensions = [50,80,15];
tx = [25,2,5];
rx = [25,4,2];
ir = acousticRoomResponse(roomDimensions,tx,rx,...
    SampleRate=fs,ImageSourceOrder=6,...
    MaxNumRayReflections=50,NumStochasticRays=4000);
Generate the speech transmission index for public address (STIPA) excitation signal using stipaExcitation.
x = stipaExcitation(fs);
Model a real-world measurement by filtering the excitation signal through the impulse response.
y = fftfilt(ir',x);
Calculate STIPA using speechTransmissionIndex.
sti = speechTransmissionIndex(y,x,fs)
sti =
0.6188
To apply ambient noise correction to the speech transmission index (STI) calculation, you need to measure both the acoustic level of the test signal and the background noise. Use the indirect method if the signal level and impulse response were measured separately.
Load the impulse response and sample rate from an existing audio file.
[ir,fs] = audioread("ChurchImpulseResponse-16-44p1-mono-5secs.wav");The IEC 602618-16:2020 standard recommends specific speech levels for each of the seven octave bands representing typical male speech, so that their combined level is 60 dB A-weighted.
standardSignalLevel = 60 + [-2.5 0.5 0 -6 -12 -18 -24];
Confirm the signal level corresponds to a 60 dB A-weighted signal.
standardSignalIntensity = db2pow(standardSignalLevel);
aWeighting = db2pow([-16.1 -8.6 -3.2 0 1.2 1 -1.1]);
pow2db(sum(aWeighting.*standardSignalIntensity))
ans =
60.0205
To simulate a condition with a raised vocal effort, set the A-weighted speech level to 70 dB. These values are from a study that amended the standard typical male speech spectrum [2].
raisedSignalLevel = [67.3 70.3 69.6 63.6 57.6 51.6 45.6];
Confirm the raised level corresponds to a 70 dB A-weighted signal.
raisedSignalIntensity = db2pow(raisedSignalLevel);
pow2db(sum(aWeighting.*raisedSignalIntensity))
ans =
69.6547
Calculate the STI for both the standard and raised speaking levels by using the OperationalSignalLevel name-value argument. The STI for the raised speaking voice is higher than the standard speaking voice.
standardSTI = speechTransmissionIndex(ir,fs,OperationalSignalLevel=standardSignalLevel)
standardSTI =
0.4792
raisedSTI = speechTransmissionIndex(ir,fs,OperationalSignalLevel=raisedSignalLevel)
raisedSTI =
0.5078
Load the impulse response and sample rate from an existing audio file.
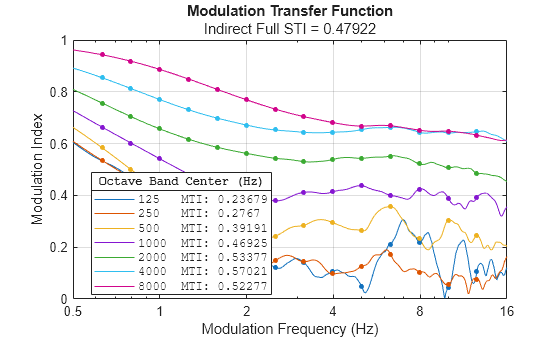
[ir,fs] = audioread("ChurchImpulseResponse-16-44p1-mono-5secs.wav");Calculate the speech transmission index (STI), modulation transfer index (MTI), and modulation transfer function (MTF).
[sti,mti,mtf] = speechTransmissionIndex(ir,fs)
sti =
0.4792
mti=1×7 table
      125       250        500       1000       2000       4000       8000
    _______    ______    _______    _______    _______    _______    _______

    0.23679    0.2767    0.39191    0.46925    0.53377    0.57021    0.52277
mtf=14×7 table
              125         250         500       1000       2000       4000       8000
            ________    ________    _______    _______    _______    _______    _______

    0.63     0.53326     0.53476    0.58379     0.6637    0.75643     0.8541    0.94291
    0.8      0.47081     0.46602    0.50007    0.60231    0.70411    0.81263    0.91801
    1        0.41848     0.39282    0.42025    0.54126     0.6568    0.77004    0.88643
    1.25     0.36372     0.30972    0.35542    0.48247    0.61687    0.73048    0.84927
    1.6      0.28554     0.22537    0.29849    0.43454    0.58553    0.69813    0.80911
    2        0.18122     0.13482    0.25023    0.40107    0.56226    0.67173    0.76941
    2.5      0.12269     0.14755    0.24224    0.37902    0.54325    0.65261    0.73321
    3.15     0.14069      0.1435    0.28479    0.41172    0.53038    0.64377    0.70414
    4        0.10554    0.097203    0.29454    0.41365    0.53862    0.64385    0.68115
    5       0.049324     0.12636    0.26394    0.43722    0.54322    0.65395    0.66781
    6.3      0.20993     0.17308    0.35553     0.4005      0.552    0.66281    0.66887
    8        0.21814     0.10417    0.23267    0.42406    0.52152    0.64389    0.65192
    10      0.043357    0.055335    0.30427    0.38937    0.50608    0.64095    0.64827
    12.5     0.10681    0.076817    0.24498    0.39135    0.48466    0.64566    0.63223
Plot the uncorrected MTF by calling speechTransmissionIndex with no output arguments. The convenience plot also displays the STI and MTI for each octave band.
speechTransmissionIndex(ir,fs)
Input Arguments
Name-Value Arguments
Output Arguments
More About
Algorithms
This diagram provides a high-level overview of the algorithm.
References
[1] IEC 60268-16:2020. "Sound system equipment — Part 16: Objective rating of speech intelligibility by speech transmission index." International Electrotechnical Commission.
[2] Leembruggen, Glenn, et al. “The Effect on STI Results of Changes to the Male Test-Signal Spectrum.” Institute of Acoustics, vol. 38 pt. 2, 2016, pp. 78–87.
Extended Capabilities
Version History
Introduced in R2026a