plot
Draw 2-D line plot of DataMatrix
Description
Examples
Load the MAT-file, provided with the software, that contains yeast data. This MAT-file includes three variables: yeastvalues, a 614-by-7 matrix of gene expression data, genes, a cell array of 614 GenBank® accession numbers for labeling the rows in yeastvalues, and times, a 1-by-7 vector of time values for labeling the columns in yeastvalues.
load filteredyeastdataCreate variables to contain a subset of the data, specifically the first five rows and first four columns of the yeastvalues matrix, the genes cell array, and the times vector.
yeastvalues2 = yeastvalues(1:5,1:4); genes2 = genes(1:5,:); times2 = times(1:4);
Create a DataMatrix object.
dmo = bioma.data.DataMatrix(yeastvalues2,genes2,times2)
dmo =
0 9.5 11.5 13.5
SS DNA -0.131 1.699 -0.026 0.365
YAL003W 0.305 0.146 -0.129 -0.444
YAL012W 0.157 0.175 0.467 -0.379
YAL026C 0.246 0.796 0.384 0.981
YAL034C -0.235 0.487 -0.184 -0.669
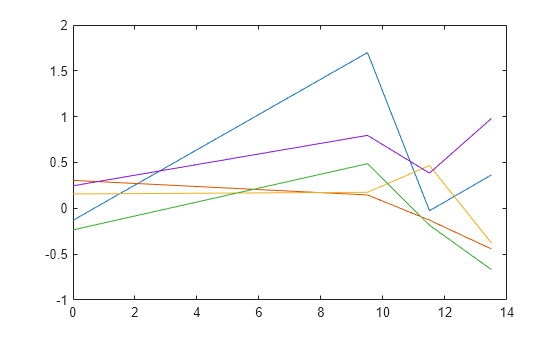
Plot the yeast values as a function of time. In other words, create a time plot of each row (gene).
plot(times2,dmo)

Input Arguments
DataMatrix, specified as a bioma.data.DataMatrix object or numeric
array.
If both DMObj1 and DMObj2 are input
arguments, one of the inputs can be a numeric array.
If
DMObj1andDMObj2are both vectors, they must have the same number of elements, andplotplots one vector versus the other vector, creating a single line.If one is a vector and one a scalar,
plotplots discrete points vertically or horizontally, at the scalar value.If one is a vector and one a matrix, the number of elements in the vector must equal either the number of rows or the number of columns in the matrix, and
plotplots the vector versus each row or column in the matrix.If both are matrices, they must have the same size (number of rows and columns), and
plotplots each column inDMObj1versus the corresponding column inDMObj2.
Line specifications, specified as a character vector or string scalar. You can specify the line style, marker symbol, and color. For details, see Line Specifications.
Data Types: char | string
More About
The following tables list available line styles, markers, and colors.
| Line Style | Description | Resulting Line |
|---|---|---|
"-" | Solid line |
|
"--" | Dashed line |
|
":" | Dotted line |
|
"-." | Dash-dotted line |
|
| Marker | Description | Resulting Marker |
|---|---|---|
"o" | Circle |
|
"+" | Plus sign |
|
"*" | Asterisk |
|
"." | Point |
|
"x" | Cross |
|
"_" | Horizontal line |
|
"|" | Vertical line |
|
"square" | Square |
|
"diamond" | Diamond |
|
"^" | Upward-pointing triangle |
|
"v" | Downward-pointing triangle |
|
">" | Right-pointing triangle |
|
"<" | Left-pointing triangle |
|
"pentagram" | Pentagram |
|
"hexagram" | Hexagram |
|
| Color Name | Short Name | RGB Triplet | Appearance |
|---|---|---|---|
"red" | "r" | [1 0 0] |
|
"green" | "g" | [0 1 0] |
|
"blue" | "b" | [0 0 1] |
|
"cyan"
| "c" | [0 1 1] |
|
"magenta" | "m" | [1 0 1] |
|
"yellow" | "y" | [1 1 0] |
|
"black" | "k" | [0 0 0] |
|
"white" | "w" | [1 1 1] |
|
Version History
Introduced in R2008b
See Also
MATLAB Command
You clicked a link that corresponds to this MATLAB command:
Run the command by entering it in the MATLAB Command Window. Web browsers do not support MATLAB commands.
选择网站
选择网站以获取翻译的可用内容,以及查看当地活动和优惠。根据您的位置,我们建议您选择:。
您也可以从以下列表中选择网站:
如何获得最佳网站性能
选择中国网站(中文或英文)以获得最佳网站性能。其他 MathWorks 国家/地区网站并未针对您所在位置的访问进行优化。
美洲
- América Latina (Español)
- Canada (English)
- United States (English)
欧洲
- Belgium (English)
- Denmark (English)
- Deutschland (Deutsch)
- España (Español)
- Finland (English)
- France (Français)
- Ireland (English)
- Italia (Italiano)
- Luxembourg (English)
- Netherlands (English)
- Norway (English)
- Österreich (Deutsch)
- Portugal (English)
- Sweden (English)
- Switzerland
- United Kingdom (English)