mattest
Two-sample t-test to evaluate differential expression of genes from two experimental conditions or phenotypes
Syntax
Description
pvalues = mattest(xdata,ydata)xdata and
ydata. The function returns a
p-value for each gene.
xdata contains data from one experimental
condition and ydata contains data from
another experimental condition. For example,
xdata could be expression
values from cancer cells, and ydata
could be expression values from normal cells.
xdata and ydata must
have the same number of rows and are assumed to be normally
distributed in each class with equal variances.
pvalues = mattest(xdata,ydata,Name=Value)ShowPlot to
true.
Examples
Load the Affymetrix® data from a prostate cancer study. The data is probe intensity data from Affymetrix HG-U133A GeneChip® arrays. A Bioinformatics Toolbox™ MAT file named prostatecancerexpdata contains the data.
load prostatecancerexpdataVariables named dependentData and independentData provide two matrices of gene expression values from two experimental conditions.
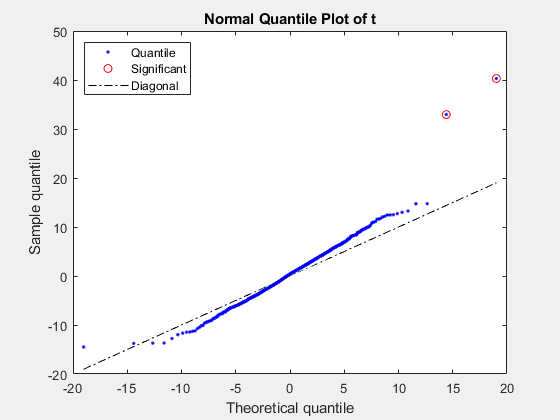
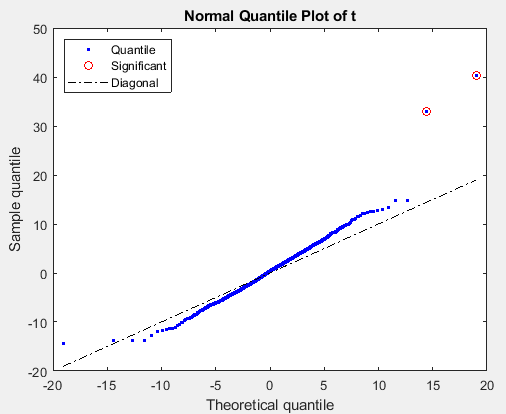
Calculate the p-values and t-scores for the gene expression values in the two matrices. Display a normal t-score quantile plot.
[pv,ts] = mattest(dependentData,independentData,ShowPlot=true);
Calculate the p-values and t-scores using 1000 permutation tests. Display histograms of t-score and p-value distributions.
[permpv,permts] = mattest(dependentData,independentData,...
    Permute=true,ShowHist=true);
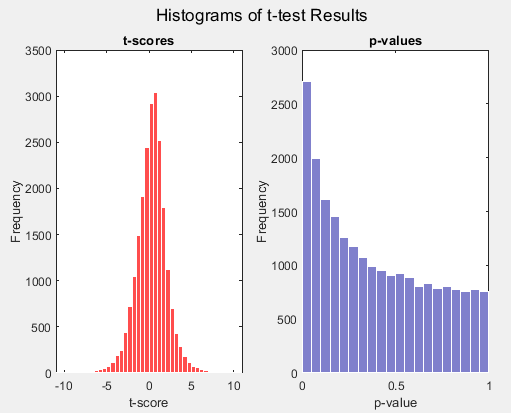
Calculate the p-values and t-scores using 2000 bootstrap tests. Display histograms of t-score and p-value distributions.
[bootpv,bootts] = mattest(dependentData,independentData,...
    Bootstrap=2000,ShowHist=true);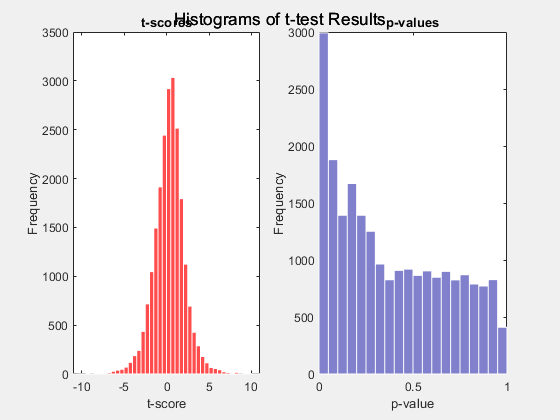
The prostatecancerexpdata.mat file used in this example contains data from Best et al., 2005.
Input Arguments
Name-Value Arguments
Specify optional pairs of arguments as
Name1=Value1,...,NameN=ValueN, where Name is
the argument name and Value is the corresponding value.
Name-value arguments must appear after other arguments, but the order of the
pairs does not matter.
Example: mattest(xdata,ydata,Bootstrap=2000,ShowHist=true);
Variance type of the test, specified as
"unequal" or
"equal".
"unequal"— Perform the test assuming the two samples have unknown and unequal variances."equal"— Perform the test assuming the two samples have equal variances.
Permutation testing, specified as
true, false,
or an integer greater than
2.
When set to true, the
number of permutations is
1000.
To specify how many permutation tests run,
specify an integer greater than
2.
Bootstrap testing, specified as
true, false,
or an integer greater than
2.
When set to true, the
number of bootstrap tests is
1000.
To specify how many bootstrap tests run,
specify an integer greater than
2.
Histogram of t-score and p-value
distributions, specified as
true or
false.
To display a histogram, set this argument to
true.
Normal t-score quantile plot, specified as
true or
false.
The black diagonal line represents the sample quantile being equal to the theoretical quantile.
Data points of genes considered to be
differentially expressed lie farther away from
this line. Specifically, data points with t-scores
greater than
(1-1/(2N))
or less than
1/(2N)
display with red circles. N is
the total number of genes.
Output Arguments
References
[1] Review Literature: Huber, W., von Heydebreck, A., Sültmann, H., Poustka, A., and Vingron, M. (2002). Variance stabilization applied to microarray data calibration and to the quantification of differential expression. Bioinformatics 18 (Suppl. 1), S96–S104.
[2] Best, C.J.M., Gillespie, J.W., Yi, Y., Chandramouli, G.V.R., Perlmutter, M.A., Gathright, Y., Erickson, H.S., Georgevich, L., Tangrea, M.A., Duray, P.H., Gonzalez, S., Velasco, A., Linehan, W.M., Matusik, R.J., Price, D.K., Figg, W.D., Emmert-Buck, M.R., and Chuaqui, R.F. (2005). Molecular alterations in primary prostate cancer after androgen ablation therapy. Clinical Cancer Research 11, 6823–6834.
Version History
Introduced in R2006a
See Also
maboxplot | mafdr | mainvarsetnorm | mairplot | maloglog | malowess | manorm | mavolcanoplot