Dashboard in Polyspace Desktop User Interface
This topic focuses on the Polyspace® desktop user interface. To learn about the equivalent pane in the Polyspace Access™ web interface, see Dashboard in Polyspace Access Web Interface (Polyspace Access).
The Dashboard pane provides statistics on the analysis results in a graphical format.
When you open a results file in Polyspace, this pane is displayed by default. You can view the following graphs:
Code Covered by Analysis

From this graph you can obtain the following information:
Files: Ratio of analyzed files to total number of files. If a file contains a compilation error, Polyspace Bug Finder™ does not analyze the file.
If some of your files were only partially analyzed because of compilation errors, this pane contains a link stating that some files failed to compile. To see the compilation errors, click the link and navigate to the Output Summary pane.
Functions: Ratio of analyzed functions to total number of functions in the analyzed files. If the analysis of a function takes longer than a certain threshold value, Polyspace Bug Finder does not analyze the function.
Defect Distribution by Impact
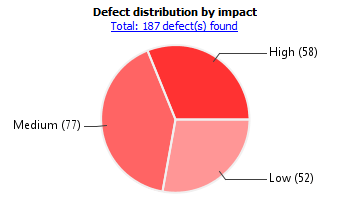
From this pie chart, you can obtain a graphical visualization of the defect distribution by impact. You can find at a glance whether the defects that Polyspace Bug Finder found in your code are low-impact defects. For more information on impact, see Classification of Defects by Impact.
Defect Distribution by Category or File
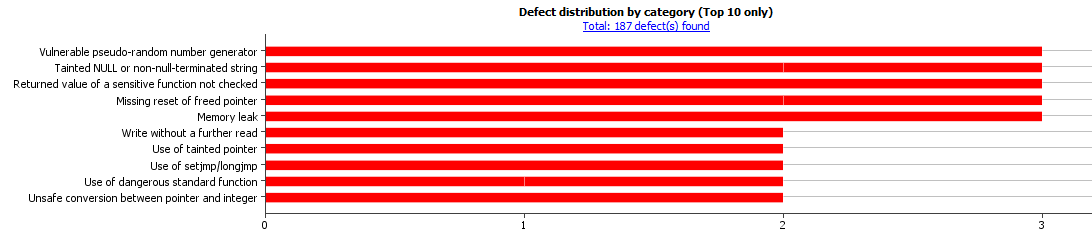
From this graph you can obtain the following information.
| Category | File | |
|---|---|---|
| Top 10 | The ten defect types with the highest number of individual defects.
Use this view to organize your check review starting at defect types with more individual defects. | The ten source files with the highest number of defects.
Use this view to organize your check review starting at files with more defects. |
| Bottom 10 | The ten defect types with the lowest number of individual defects. Each column on the graph is divided the same way as the Top 10 defect types. Use this view to organize your check review starting at defect types with fewer individual defects. | The ten source files with the lowest number of defects. Each column on the graph is divided the same way as the Top 10 files. Use this view to organize your check review starting at files with fewer defects. |
Coding Rule Violations by Rule or File
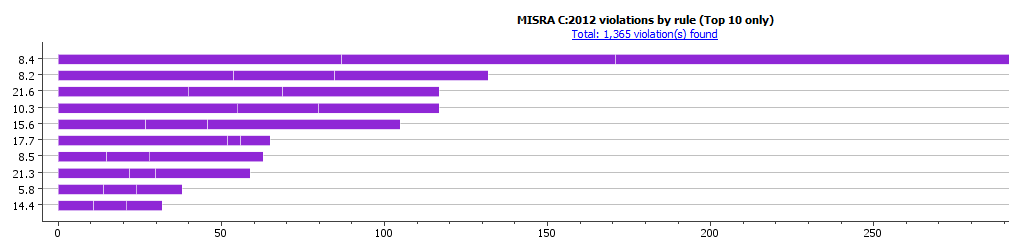
For every type of coding rule that you check (MISRA™, JSF®, or custom), the Dashboard contains a graph of the rule violations.
From this graph you can obtain the following information.
| Category | File | |
|---|---|---|
| Top 10 | The ten rules with the highest number of violations.
Use this view to organize your review starting at rules with more violations. | The ten source files containing the highest number of violations.
Use this view to organize your review starting at files with more rule violations. |
| Bottom 10 | The ten rules with the lowest number of violations. Each column on the graph is divided in the same way as the Top 10 rules. Use this view to organize your review starting at rules with fewer violations. | The ten source files containing the lowest number of rule violations. Each column on the graph is divided in the same way as the Top 10 files. Use this view to organize your review starting at files with fewer rule violations. |
Other Dashboard Features
You can also perform the following actions on this pane:
Filter results from the Results List pane.
Click the graphs on the Dashboard pane to narrow down the results list to the results shown by the graphical elements. For instance, you can click the high-impact section of the defect distribution pie chart to see only defects with high impact. For all the ways you can filter results, see Filter and Group Results in Polyspace Desktop User Interface.
View the configuration used to obtain the result.
Click the Configuration link on the Dashboard pane to open a read-only form of the configuration. For more information on the options in the Configuration pane, see Complete List of Polyspace Bug Finder Analysis Engine Options.
View the modeling of the multitasking configuration of your code.
Click the Concurrency modeling link on the Dashboard pane to see all entry points to your program. For a description of the Concurrency modeling pane, see Concurrency modeling.