Interpret Polyspace Bug Finder Results in Polyspace Platform User Interface
This topic describes how to review and interpret a result of a Polyspace® Bug Finder™ analysis in the Polyspace Platform user interface.
View Results
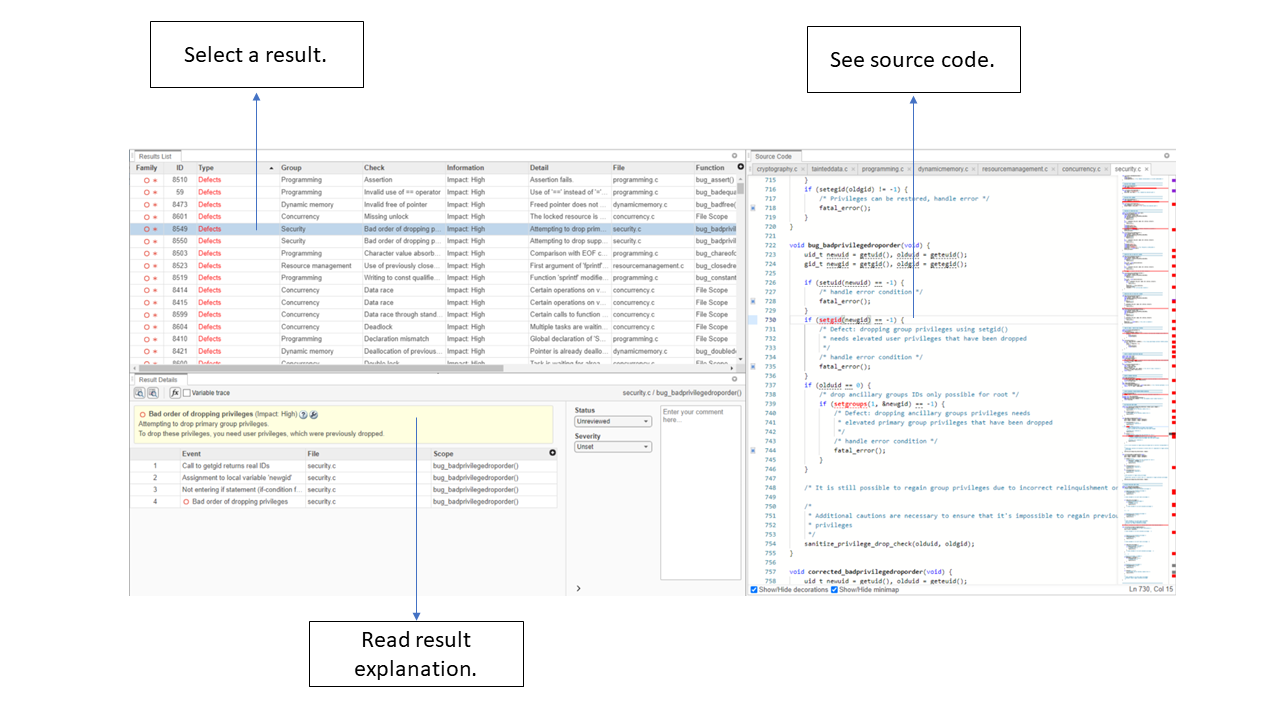
There are two different perspectives when viewing results: the Dashboard which summarizes the results and the Review which shows result details. You can switch between the perspectives in the toolstrip.
Select a results file in the Results pane and select Review in the toolstrip to open the results in the Review perspective. For more information on how to open results, see Open Polyspace Results in Polyspace Platform User Interface.
When you open the results of a Polyspace Bug Finder analysis, you see a list on the Results List pane. The results consist of defects, coding rule violations, and code metrics.
Start by narrowing the focus of your review:
Use filters in the Filters section of the toolstrip to narrow down the list. For example, use the High Severity filter to focus on high severity defects.
Organize results by result family. Click a column title to sort the column. Use the Show only and Filter out options to include, or exclude entire result families.
For more information on filtering the results list, see Filter and Sort Results in Polyspace Platform User Interface.
Once you narrow down the list, you can begin reviewing individual results.
To begin your review, select a result in the Results List.

Interpret Result Details Message
The first step is to understand the nature of the issue. Read the message on the Result Details pane and the related line of code on the Source pane.
Seek Additional Resources for Help
Sometimes, you need additional help for certain results. Click the ![]() icon in the Result Details pane to open a help page for the selected result. Help pages contain code examples to illustrate the result and why the issue happens. Check documentation for external standards such as CWE or CERT-C that provide additional rationale for fixing the issue.
icon in the Result Details pane to open a help page for the selected result. Help pages contain code examples to illustrate the result and why the issue happens. Check documentation for external standards such as CWE or CERT-C that provide additional rationale for fixing the issue.
Find Root Cause of Result
Sometimes, the root cause of a result might be far from the location in the code where you see the result. For instance, a variable that you read might be non initialized because the initialization is not reachable by the code. Polyspace displays the defect when you read the variable, but the root cause can be a previous if or while condition that is always false.
Navigate to Related Events
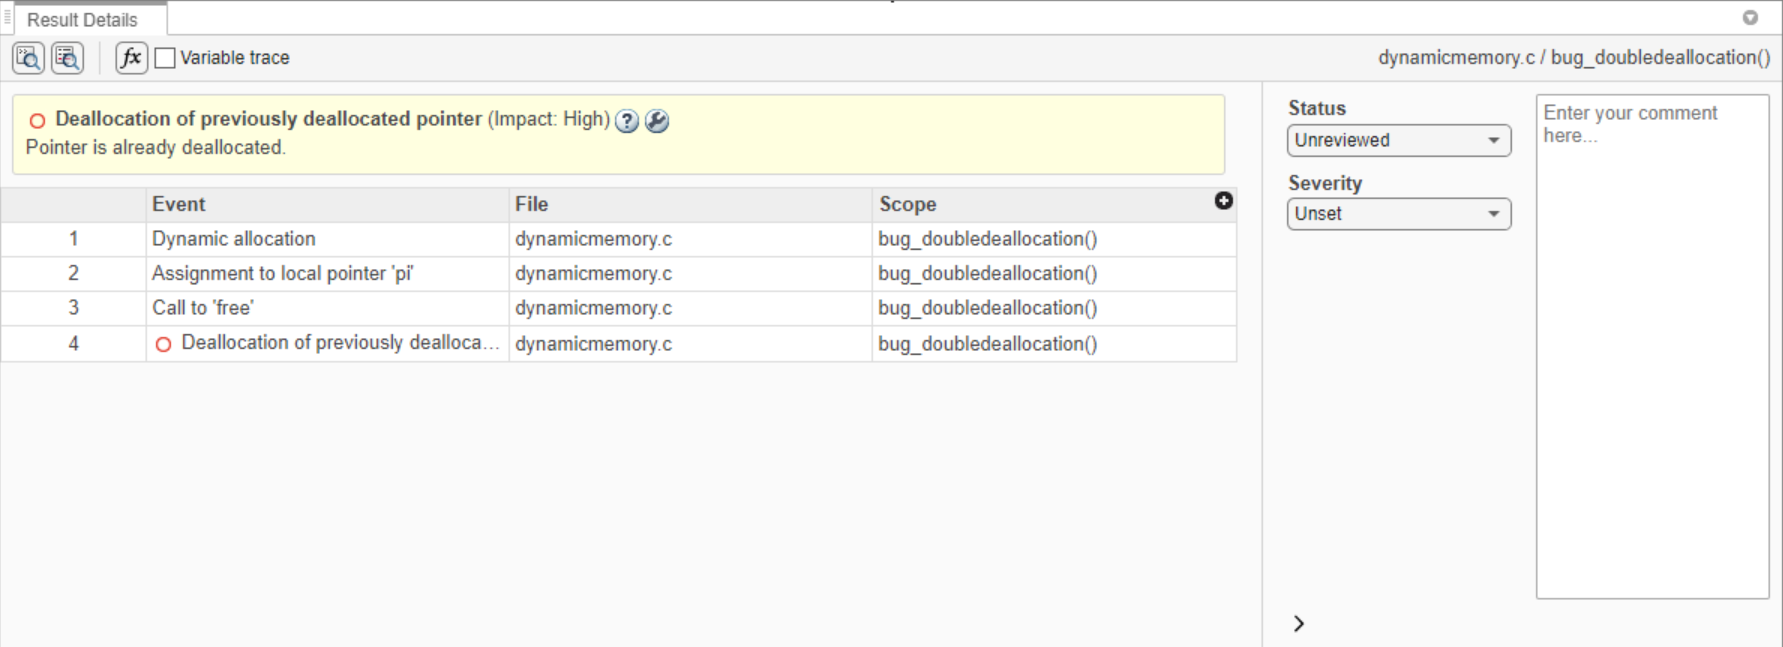
Typically, the Result Details pane shows one sequence of events that leads to the result. The Source Code pane also highlights these events.

In the above traceback:
int* piis dynamically allocated and assigned a value.The function call
free(pi)occurs to decallocatepi.A second call to
free(pi)occurs, butpihas already been deallocated.
Typically, the traceback shows major points in the control flow such as entering or bypassing conditional statements or loops, entering a function, and so forth. For specific defects, the traceback shows other kinds of events relevant to the defect. For instance, for a Declaration mismatch defect, the traceback shows the two locations with conflicting declarations.
You can select each event in the traceback to show the location in the Source Code pane where the selected event takes place.
Create Your Own Navigation Path
If the event traceback is not available, use other navigation tools to trace your own path through the code.
Before you begin navigating through pathways in your code, ask the question: What am I looking for? Based on your answer, choose the appropriate navigation tool. For instance:
To investigate a Non-initialized variable defect, you might want to make sure that the variable is not initialized at all in the code. To look for previous instances of the variable, on the Source Code pane, select and right-click the variable and select Search For All References. This shows only instances of a specific variable and not other variables with the same name in other scopes.
To investigate the root cause of a defect, you can navigate from the defect to the line in code that Polyspace determines is a possible cause. Right-click a defect in the Source Code pane and select Go To Cause.
To investigate a rule violation, you can navigate from a function call to a function definition. Right-click the function and select Go To Definition.