Result Details in Polyspace Desktop User Interface
This topic focuses on the Polyspace® desktop user interface. To learn about the equivalent pane in the Polyspace Access™ web interface, see Result Details in Polyspace Access Web Interface (Polyspace Access).
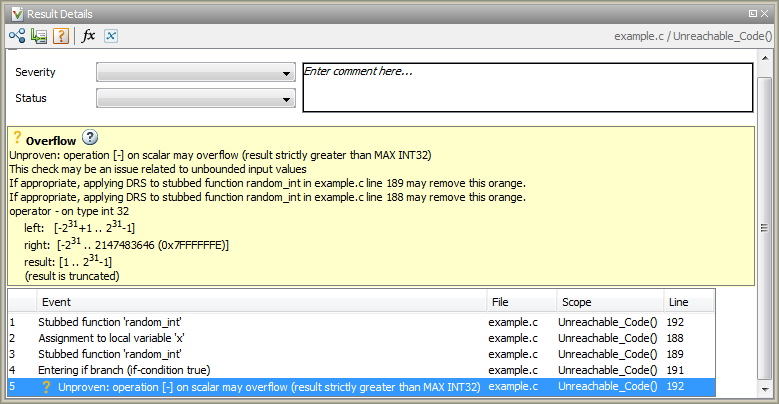
On the Results List pane, if you select a check, you see additional information on the Result Details pane.
On this pane, you can also assign a Severity and Status to each check. You can also enter comments to describe the results of your review. This action helps you track the progress of your review and avoid reviewing the same check twice.
For results that you open from Polyspace Access, you can also:
Assign a reviewer to the result. A reviewer can filter the Results List to only show results that are assigned to him or her.
Create a ticket in a bug tracking tool (BTT) such as JIRA. Once you create the ticket the Results Details for this defect shows the ticket ID. Click the ID to open the ticket in the BTT interface.
See Open or Export Results from Polyspace Access (Polyspace Access).

View Traceback
Sometimes, on the Result Details pane, you can see the sequence of instructions leading to the check (traceback). You can select each instruction and navigate to it in your source code.

The following columns appear in the traceback:
| Column | Description |
|---|---|
| Event | Code instructions related to the defect. For instance, if an Out of Bounds Array Index error occurs in a loop, the Result Details pane can show updates to the array index that occur inside the loop. The update statements might physically occur in your code before or after the array access. However, because the statements occur in a loop, they are related to the array access. |
| Scope | Function containing the instructions. If the instructions are not in a function, the column lists the file containing the instructions. |
| Line | Line number of the instruction. |
View Error Call Graph
Click the Show error call graph icon, ![]() in the Result Details pane toolbar to
display the call sequence that leads to the code associated with a result.
in the Result Details pane toolbar to
display the call sequence that leads to the code associated with a result.

For global variables, this graph shows the call sequence leading to read and write operations on the global variable.
View Call Hierarchy and Variable Access
From the Result Details pane, you can open the Call Hierarchy and Variable Access panes.
Select the
 button to open the Call
Hierarchy pane.
button to open the Call
Hierarchy pane.On this pane, you can see the function in which the current check occurs, along with its callers and callees. For more information, see Call Hierarchy in Polyspace Desktop User Interface.
Select the
 button to open the Variable
Access pane.
button to open the Variable
Access pane.On this pane, you can see the global variables in your code. For more information, see Variable Access in Polyspace Desktop User Interface.