Review Results of Impact Analysis in Polyspace Code Prover
You can use Polyspace® Code Prover™ to prove that two objects in your C/C++ program do not impact each other. If you designate the two objects as a source and a sink, a Code Prover analysis can detect if the source values impact the sink values or can prove the absence of impact. An impact occurs if there is uninterrupted data flow from the source to the sink (or if the value of the source variable determines if the sink variable acquires a specific value).
This example shows how to review the results of impact analysis in Polyspace Code Prover. For more information on how to run impact analysis, see Prove Absence of Impact Between Objects in C/C++ Program.
Example Files
This tutorial walks through how to review impact analysis results. If you want to
look at sample results while following the steps, run impact analysis on the source
files in
polyspaceroot\polyspace\examples\doc_cxx\impact_analysispolyspacerootC:\Program
Files\Polyspace\R2025b.
View Results of Impact Analysis
After running impact analysis, you can see the results in one of the following places:
You can see the results in a flat list on the Results List pane along with other Code Prover results. All impact analysis results appear in a group named Specifications. If your Code Prover results set contains other results, you can filter to this group to focus on impact analysis results only.
You can see the impact analysis results separately on the Impact Analysis pane. On this pane, you can see the results organized by impact source or impact sink. For more information, see Organize Impact Analysis Results by Source or Sink.
The impact analysis results consist of two checks:
Expected impact: For eachimpactelement in your specification file with a source and sink pair, the check determines if the source had the expected impact on the sink.The check color is:
Red if there is a proven absence of impact.
Orange if there is a possible impact.
You can investigate the red checks to see why your specification is violated and fix the issue. You can also investigate the orange checks to make sure that your specification is not violated and fix or justify the issue.
Expected absence of impact: For eachno-impactelement in your specification file with a source and sink pair, the check determines if the source had the expected absence of impact on the sink.The check color is:
Green if there is a proven absence of impact.
Orange if there is a possible impact.
You can investigate the orange checks to make sure that your specification is not violated and fix or justify the issue.
To review the result of a check:
Select the result on the Results List pane.
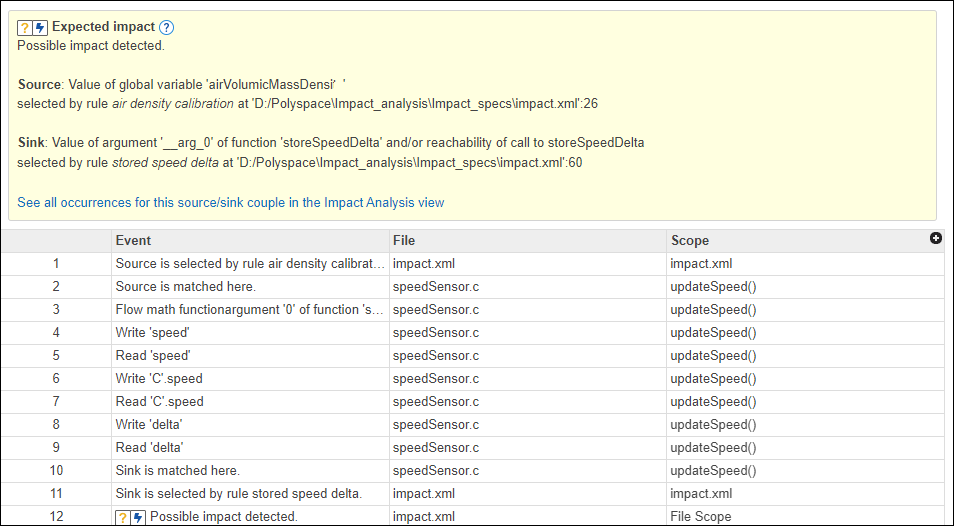
The Result Details pane lists the source and sink pair that leads to the result. You see a message such as the following:
Here,Possible impact detected between source and sink. Source:sourceNameSink:sinkNamesourceNamesinkName
The Source pane shows the impact specification in the XML file that triggers the check.
If the result is orange, there are one or more paths from the source to the sink. The event list on the Result Details pane shows one such path. Select each item in this list to navigate to the corresponding source code location on the Source pane.
Trace Path from Source to Sink
For results that are orange, you can click each element in the event list below the result and trace a path from a source of impact to a sink.
The following is an example event list along with an explanation of what each item means and the source code location associated with the item (when you click the item, the Source pane updates to this location).
| Event | What This Means | Source Code Location |
|---|---|---|
Source is selected by rule | The source that leads to the impact is defined in your impact specification XML file with an | Location in the XML file that defines the source with an |
Source is matched here. | The source defined in the impact specification XML file with an | Location of the source in the C/C++ code. |
Write | A variable with the name | Location of the write operation on |
Read | The variable with the name | Location of the read operation on |
Control: Conditionally modified | The variable with the name | Opening and closing braces of the block controlled by a condition. The condition expression contains the variable with the name |
Return from | Control moves from a callee function | Closing brace of the callee function |
Back to | Control moves from a callee function to a caller | Location in the function |
Sink is matched here. | The sink defined in the impact specification XML file with an | Location of the sink in the C/C++ code. |
Source is selected by rule | The sink that is impacted is defined in your impact specification XML file with an | Location in the XML file that defines the sink with an |
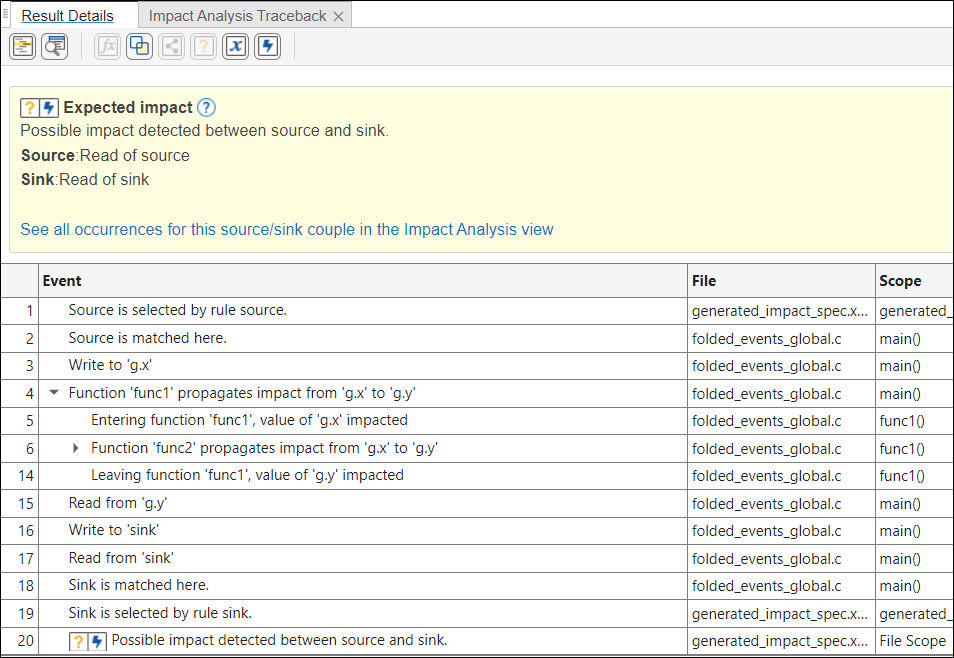
When reviewing impact analysis results in the web browser, you can see the event list collapsed for easier review. If there is an impact flow across a function, you see a collapsed node in the event list that describes the impact flow at a higher level. You can expand this node to see further details of the impact flow.
For instance, the following event list contains a collapsed event:
Function 'func1' propagates impact from 'g.x' to 'g.y'g.x and when leaving the function, the impact flow continues through the value of g.y. You can expand the node to see further details of how the value of g.x
impacts the value of g.y.
Organize Impact Analysis Results by Source or Sink
Instead of viewing the impact analysis results in a flat list along with other Code Prover results, you can organize them by impact source or impact sink.
To view impact analysis results organized by impact sources:
Open the Impact Analysis pane using one of these methods:
Select Window > Impact Analysis.
Select an impact analysis result on the Results List pane. On the Result Details pane, click the
 icon or the link See all occurrences for this source/sink couple in the Impact Analysis view.
On the Impact Analysis pane, select View by Sources. You can also enter the name of an impact source or impact sink in the search box to view all occurrences of that source or sink.
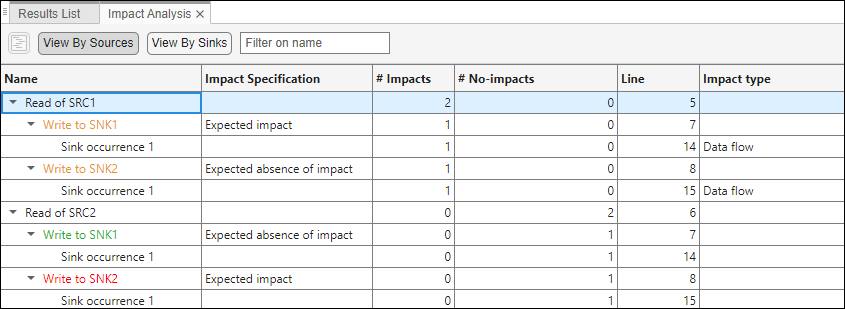
For example, in the following image, you see two impact analysis sources:
Read of SRC1– The variable
SRC1acts as an impact analysis source when read. This source possibly impacts two sinks:Write to SNK1– The variable
SNK1acts as an impact analysis sink when written. Such a write operation occurs only once. Click on the link Sink occurrence 1 to navigate to this write operation in the source code and to see a path from the source to the sink on the Impact Analysis Traceback pane.Write to SNK2– The variable
SNK2acts as an impact analysis sink when written. This write operation also occurs once.
Read of SRC2– The variable
SRC2acts as an impact analysis source when read. This source has no impact on any sink, so you see the following nodes:Write to SNK1– The variable
SNK1is completely decoupled from this source when written. Therefore, the impact analysis result for the specification Expected absence of impact is green.Write to SNK2– The variable
SNK2is also completely decoupled from this source when written. Therefore, the impact analysis result for the specification Expected impact is red.

For each source, the # Impacts column shows the number of sinks impacted by the source and the # No-impacts column shows the number of sinks that are completely decoupled from the source.
See Also
Enable impact analysis (-impact-analysis) | Specify sources and sinks (-impact-specifications) | Show impact analysis results only (-impact-analysis-only) | Expected impact | Expected absence of impact