Run Static Analysis in Polyspace Platform User Interface
This topic outlines the brief steps for running static analysis on the source code added to a Polyspace Platform project. For more information on how to create a project, see Create Project and Add Source Files in Polyspace Platform User Interface.
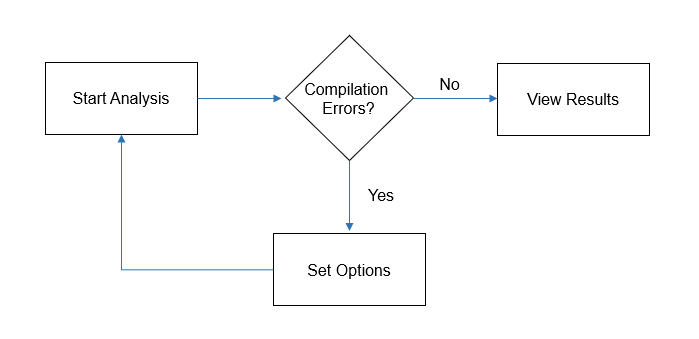
During analysis, Polyspace® first compiles your code and then checks for bugs (Bug Finder) or proves code correctness (Code Prover). If you encounter compilation errors, read the error message and diagnose the root cause of the error. To resolve the errors, you often have to set some Polyspace configuration options and rerun the analysis.

Set Configuration Options
In the Polyspace Platform user interface, you can access all the functionality of Polyspace Bug Finder™, Polyspace Code Prover™, and Polyspace Test™ without switching between different applications.
To specify analysis or testing options, double-click the Configuration node of your project.
The Configuration tab contains several sections such as Project, Build, Static Analysis, and Testing & Profiling. Each section contains related configuration options you can use for your analysis. For example:
If you are running a Polyspace Bug Finder analysis, set your checkers activation file on the Static Analysis tab on the Defects and Coding Standards node.
If you want to generate a report for static analysis results, specify a report template and output format on the Static Analysis tab on the Reporting node
Start and Monitor Analysis
To begin an analysis, select a project in the Projects pane and click Find Issues followed by the type of analysis you intend to run (Find Issues for Bug Finder or Prove Absence of RTEs for Code Prover). Follow the progress of the analysis on the Logs pane.
Fix Compilation Errors
If an analysis stops because of a compilation error, you see the errors on the Logs pane. To view compilation errors, scroll through the log starting at the end and working backwards.
Fix your source code and run the analysis again to proceed. For more information, see:
For more precise run-time error checking in Code Prover, it is recommended that you fix all compilation errors. Use the option Stop analysis if a file does not compile (-stop-if-compile-error).
Open Results
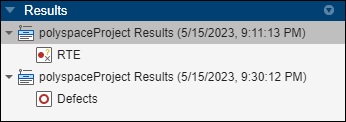
The Logs pane displays a message indicating the Polyspace analysis is complete. A list of all results in your workspace shows in the Results pane in the order they are opened or created.

Right-click a result node on the Results pane and select one of the following:
Open Dashboard to see an overview of results with graphs and summaries (Dashboard perspective).
Open Review to see details of analysis results (Review perspective). You can see:
A list of results on the Results List pane.
Further information on an individual result on the Result Details pane.
Source code associated with a result on the Source Code pane.
To switch from the Dashboard perspective to the Review perspective, click Review on the toolstrip and vice versa. Click the Project button to close the results and return to your projects.
For more information on locating and opening results, see Open Polyspace Results in Polyspace Platform User Interface.
Customize Polyspace Platform User Interface Layout
To customize your layout of the Polyspace Platform user interface, click and drag the panes to your desired location. Panes snap to certain predefined areas. Each pane contains a drop down menu with different options allowing you to maximize certain panes or rearrange all panes using a grid.