Source Code in Polyspace Desktop User Interface
This topic focuses on the Polyspace® desktop user interface. To learn about the equivalent pane in the Polyspace Access™ web interface, see Source Code in Polyspace Access Web Interface (Polyspace Access).
The Source pane shows the source code with the results highlighted with specific colors and icons. For more information, see Code Prover Result and Source Code Colors.
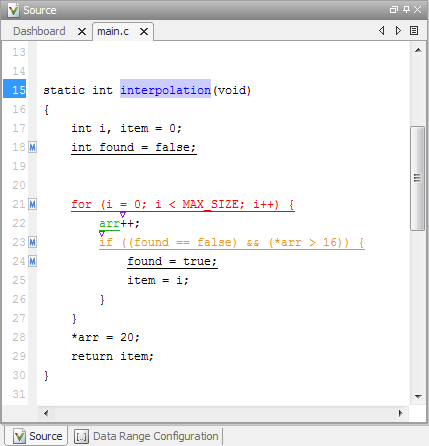
On the Source pane, you can perform the following actions.
Examine Source Code
On the Source pane, if you right-click a text string, the context
menu provides options to examine your code. For example, right-click the global variable
PowerLevel:
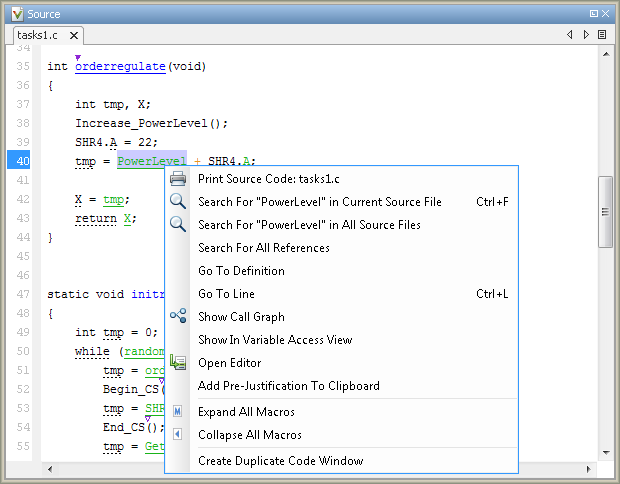
Use the following options to examine and navigate through your code:
Search "PowerLevel" in Current Source File — List occurrences of the string within the current source file in the Search pane.
Search "PowerLevel" in All Source Files — List occurrences of the string within all source files in the Search pane.
Search For All References — List all references in the Search pane. The software supports this feature for global and local variables, functions, types, and classes.
Go To Definition — Go to the line of code that contains the definition of
PowerLevel. The software supports this feature for global and local variables, functions, types, and classes. If the definition is not available to Polyspace, selecting the option takes you to the function declaration.Go To Line — Open the Go To Line dialog box. If you specify a line number and click Enter, the software displays the specified line of code.
Expand All Macros or Collapse All Macros — Display or hide the content of macros in current source file.
View Variable Ranges
Place your cursor over a check to view range information for variables, operands, function parameters, and return values.
If a tooltip is available for a keyword or identifier on the Source pane, Polyspace:
Uses solid underlining for the keyword or identifier if it is associated with a check.
Uses dashed underlining for the keyword or identifier if it is not associated with a check.

The range displayed is the same as the range that the software calculates during verification (or includes the range if rounded during display). For instance, for floating point variables, the tooltips show the variable range using the following rules:
The range appears as a collection of values, for instance
1.0 or 2.0 or NaN, or an interval[1.0 .. 2.0].The displayed range includes the actual variable range. For instance, the range
[1.0 .. 2.0]on a variable indicates that the variable cannot have the value0.9999or2.0001.However, the displayed range can also include additional values because of approximation.
Constants are displayed using either fixed point (
1.0,
                -2.0
, etc.) or scientific format when it improves readability (1.0E+10, -1.2E-20, etc.).The tooltips clearly indicate which values are shown with rounding. For instance, the value
1.0does not involve rounding but1.2345...shows a variable that is displayed with rounding towards zero.When rounded, at least 5 significant digits are displayed.
View Extent of Code Block
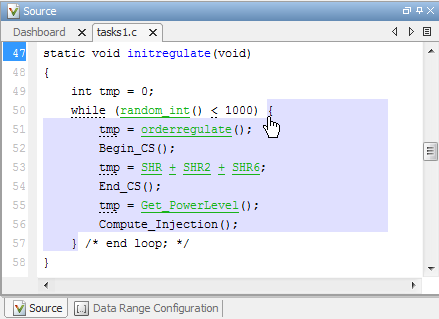
On the Source pane, to highlight a block of code, click either its opening or closing brace.
Manage Multiple Files
You can view multiple source files in the Source pane as separate tabs.
On the Source pane toolbar, right-click a view.
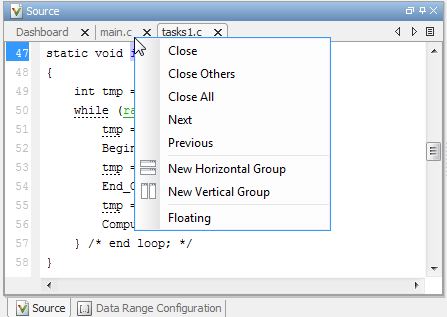
From the Source pane context menu, you can:
Close – Close the currently selected source file. You can also use the χ button to close the tabs.
Close Others – Close all source files except the currently selected file.
Close All – Close all source files.
Next – Display the next view.
Previous – Display the previous view.
New Horizontal Group – Split the Source pane horizontally to display the selected source file below another file.
New Vertical Group – Split the Source pane vertically to display the selected source file side-by-side with another file.
Floating – Display the current source file in a new window, outside the Source pane.
Expand and Collapse Macros
You can view the contents of source code macros in the source code view. A code
information bar displays M icons that identify source code lines with macros.

When you click a line with this icon, the software displays the contents of macros on that line.
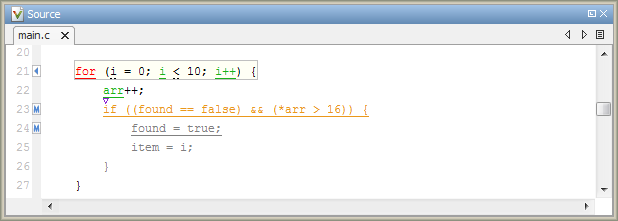
To display the normal source code again, click the line away from the shaded region, for example, on the arrow icon.
To display or hide the content of all macros:
Right-click any point within the source code view.
From the context menu, select either Expand All Macros or Collapse All Macros.
Note
The Result Details pane also allows you to view the contents of a macro if the check you select lies within a macro.
You cannot expand OSEK API macros in the Source pane.
See Function Callers and Callees
You can click on a function name to see callers and callees of the function on the Call Hierarchy pane.
When a function is defined, the source code shows the function name in blue. Click the function name to update the Call Hierarchy pane.

When a function is called, the function call either shows a run-time check color or not. If the function does not have a run-time check color (see
func2below), click the function name to update the Call Hierarchy pane.
If the function has a run-time check color (see
funcabove), right-click the function and select Go To Definition. The Call Hierarchy pane updates to show the callers and callees.