Analyze Data in TDMS Files Using Tall Arrays and Machine Learning
This example shows you how to perform big data analytics on data stored in TDMS files.
You can use logistic regression and other techniques to perform data analysis on tall arrays. Tall arrays represent data that is too large to fit into computer memory. This example uses the arrival time data of various airlines stored as a TDMS file to predict the probability of a delayed flight.
Access Data from TDMS File
Create a TDMSDatastore object to access data from a TDMS file by using the tdmsDatastore function. Select the channel group and name of channels to read from using the SelectedChannelGroup and SelectedChannels properties, respectively.
ds = tdmsDatastore('airlinesmall.tdms');
ds.SelectedChannelGroup = "ChannelGroup1";
ds.SelectedChannels = {'DayOfWeek','UniqueCarrier',...
    'ArrDelay','DepDelay','Distance'};
Convert Datastore to Tall Array
The TDMSDatastore object returns the data as a cell array. Cell arrays are not supported in the parallel environment. Avoid the use of a parallel pool and run the example in a local MATLAB® session by using the mapreducer function. Unpack the cell array data into a table using the transform function. Finally, create a tall array from the datastore using the tall function.
ds = transform(ds, @(x)x{1});
mapreducer(0);
tt = tall(ds);
tt.DayOfWeek = categorical(tt.DayOfWeek,1:7,...
    {'Sun','Mon','Tues','Wed','Thu','Fri','Sat'},'Ordinal',true)
tt =
M×5 tall table
DayOfWeek UniqueCarrier ArrDelay DepDelay Distance
_________ _____________ ________ ________ ________
Tues "PS" 8 12 308
Sun "PS" 8 1 296
Thu "PS" 21 20 480
Thu "PS" 13 12 296
Wed "PS" 4 -1 373
Tues "PS" 59 63 308
Wed "PS" 3 -2 447
Fri "PS" 11 -1 954
: : : : :
: : : : :
Delayed Flights
Define the LateFlight variable as the flights that are delayed by 20 minutes or more.
tt.LateFlight = tt.ArrDelay>=20
tt =

  M×6 tall table

    DayOfWeek    UniqueCarrier    ArrDelay    DepDelay    Distance    LateFlight
    _________    _____________    ________    ________    ________    __________

      Tues           "PS"             8          12         308         false
      Sun            "PS"             8           1         296         false
      Thu            "PS"            21          20         480         true
      Thu            "PS"            13          12         296         false
      Wed            "PS"             4          -1         373         false
      Tues           "PS"            59          63         308         true
      Wed            "PS"             3          -2         447         false
      Fri            "PS"            11          -1         954         false
        :              :             :           :           :            :
        :              :             :           :           :            :
Logistic Regression Model
Build a model to predict the probability of a delayed flight using the fitglm (Statistics and Machine Learning Toolbox) function. This model can help you determine if the results observed for each predictor individually also hold true when you consider the predictors together. For more information on the results for each individual predictor, see Logistic Regression with Tall Arrays (Statistics and Machine Learning Toolbox).
glm = fitglm(tt,'LateFlight~Distance+DayOfWeek','Distribution','binomial')
Iteration [1]:	  0% completed
Iteration [1]:	 100% completed
Iteration [2]:	  0% completed
Iteration [2]:	 100% completed
Iteration [3]:	  0% completed
Iteration [3]:	 100% completed
Iteration [4]:	  0% completed
Iteration [4]:	 100% completed
Iteration [5]:	  0% completed
Iteration [5]:	 100% completed
glm =
Compact generalized linear regression model:
    logit(LateFlight) ~ 1 + DayOfWeek + Distance
    Distribution = Binomial

Estimated Coefficients:
                       Estimate         SE         tStat       pValue
                      __________    __________    _______    __________

    (Intercept)           -1.855      0.023052    -80.469             0
    DayOfWeek_Mon      -0.072603      0.029798    -2.4365       0.01483
    DayOfWeek_Tues      0.026909      0.029239    0.92029       0.35742
    DayOfWeek_Wed         0.2359      0.028276      8.343    7.2452e-17
    DayOfWeek_Thu        0.23569      0.028282     8.3338    7.8286e-17
    DayOfWeek_Fri       -0.19285      0.031583     -6.106    1.0213e-09
    DayOfWeek_Sat       0.033542      0.029702     1.1293       0.25879
    Distance          0.00018373    1.3507e-05     13.602    3.8741e-42


123319 observations, 123311 error degrees of freedom
Dispersion: 1
Chi^2-statistic vs. constant model: 504, p-value = 8.74e-105
Prediction with Model
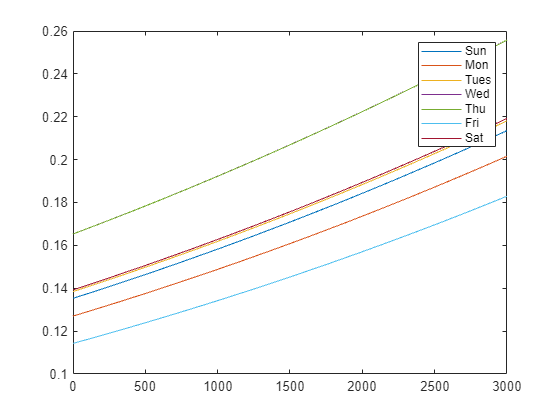
Predict the probability of a delayed flight for each day of the week for distances ranging from 0 to 3000 miles by using the gather function. Create a table to hold the predictor values by indexing the first 100 rows in the original table tt.
x = gather(tt(1:100,{'Distance' 'DayOfWeek'}));Evaluating tall expression using the Local MATLAB Session: - Pass 1 of 1: Completed in 0.2 sec Evaluation completed in 0.46 sec
x.Distance = linspace(0,3000)';
x.DayOfWeek(:) = 'Sun';
plot(x.Distance,predict(glm,x));

days = {'Sun' 'Mon' 'Tues' 'Wed' 'Thu' 'Fri' 'Sat'};
hold on
for j=2:length(days)
    x.DayOfWeek(:) = days{j};
    plot(x.Distance,predict(glm,x));
end
legend(days)
C = gather(crosstab(tt.LateFlight,predict(glm,tt)>.20))
Evaluating tall expression using the Local MATLAB Session:
- Pass 1 of 1: Completed in 1.2 sec
Evaluation completed in 1.3 sec
C = 2×2

       99613        4391
       18394        1125
Among the flights predicted to have a 20% or higher probability of being delayed, about 20% or 1125/(1125 + 4391) were delayed. Among the remaining flights, less than 16% or 18394/(18394 + 99613) were delayed.