plotpc
(即将删除)在感知器向量图上绘制分类线
以后的版本中将会删除 plotpc。有关详细信息,请参阅Transition Legacy Neural Network Code to dlnetwork Workflows。
有关更新代码的建议,请参阅版本历史记录。
语法
plotpc(W,B)

plotpc(W,B,H)
说明
plotpc(W,B) 接受以下输入,
W |
|
B |
|
并返回绘制的分类线的句柄。
plotpc(W,B,H) 接受一个额外的输入,
H | 最后绘制的线的句柄 |
并在绘制新线之前删除最后一条线。
此函数不更改当前轴,用于在 plotpv 之后调用。
示例
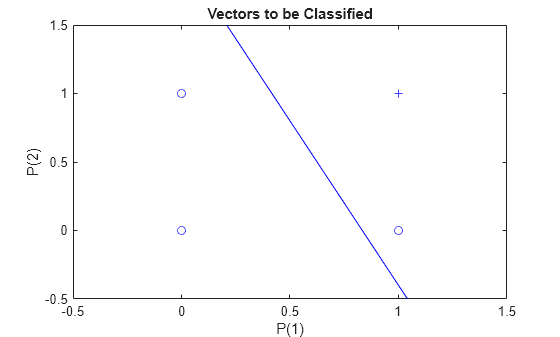
绘制分类线
以下代码定义并绘制感知器的输入和目标:
p = [0 0 1 1; 0 1 0 1];
t = [0 0 0 1];
plotpv(p,t)

以下代码创建一个感知器,为其权重和偏置赋值,并绘制生成的分类线。
net = perceptron;
net = configure(net,p,t);
net.iw{1,1} = [-1.2 -0.5];
net.b{1} = 1;
plotpc(net.iw{1,1},net.b{1})