plotresponse
(即将删除)绘制动态网络时间序列响应
以后的版本中将会删除 plotresponse。有关详细信息,请参阅Transition Legacy Neural Network Code to dlnetwork Workflows。
有关更新代码的建议,请参阅版本历史记录。
语法
plotresponse(t,y)

plotresponse(t1,'name',t2,'name2',...,y)

plotresponse(...,'outputIndex',outputIndex)
说明
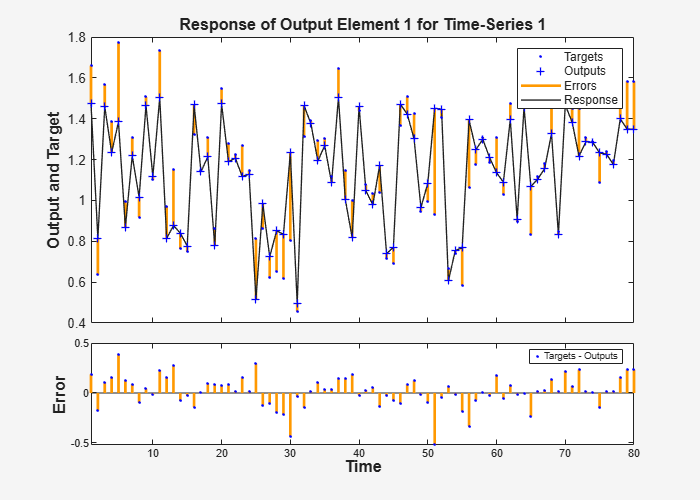
plotresponse(t,y) 接收一个目标时间序列 t 和一个输出时间序列 y,并将它们绘制在同一坐标轴上,显示它们之间的误差。
plotresponse(t1,'name',t2,'name2',...,y) 接收多个目标/名称对组(通常用于定义训练、验证和测试目标)以及输出。它绘制响应图,以不同颜色指示不同的目标集。
plotresponse(...,'outputIndex',outputIndex) 可以定义要进行相关性分析和绘制的误差元素。默认值为 1。
示例
绘制目标时间序列数据和输出时间序列数据
此示例说明如何使用 NARX 网络来求解时间序列问题。
[X,T] = simplenarx_dataset;
net = narxnet(1:2,20);
[Xs,Xi,Ai,Ts] = preparets(net,X,{},T);
net = train(net,Xs,Ts,Xi,Ai);
Y = net(Xs,Xi,Ai);
plotresponse(Ts,Y)