主要内容

二维自组织映射

如同一维问题一样,这种自组织映射将学习表示输入向量在输入空间中出现的不同区域。然而,在此示例中,神经元会形成二维网格,而不是一条线。

我们要对一个矩形中的 1000 个二元素向量进行分类。

X = rands(2,1000);
plot(X(1,:),X(2,:),'+r')

Figure contains an axes object. The axes contains a line object which displays its values using only markers.

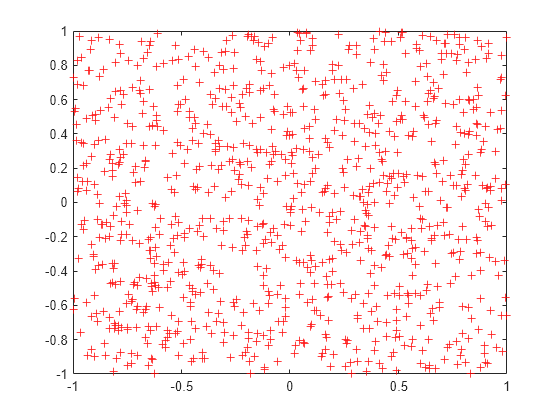
我们将使用 5×6 神经元层对上述向量进行分类。我们希望每个神经元对矩形的不同区域作出响应,相邻神经元对相邻区域作出响应。

将网络配置为匹配输入的维度。此步骤是必需的,因为我们要绘制初始权重。通常情况下,训练时会自动进行配置。

net = selforgmap([5 6]);
net = configure(net,X);

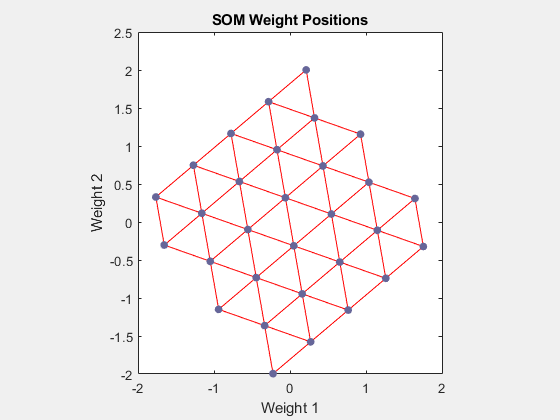
我们可以通过使用 plotsompos 可视化我们刚刚创建的网络。

每个神经元在其两个权重的位置用红点表示。最初,所有神经元的权重相同,位于向量的中间,因此只出现一个点。

plotsompos(net)

Figure SOM Weight Positions (plotsompos) contains an axes object. The axes object with title SOM Weight Positions, xlabel Weight 1, ylabel Weight 2 contains 3 objects of type line. One or more of the lines displays its values using only markers

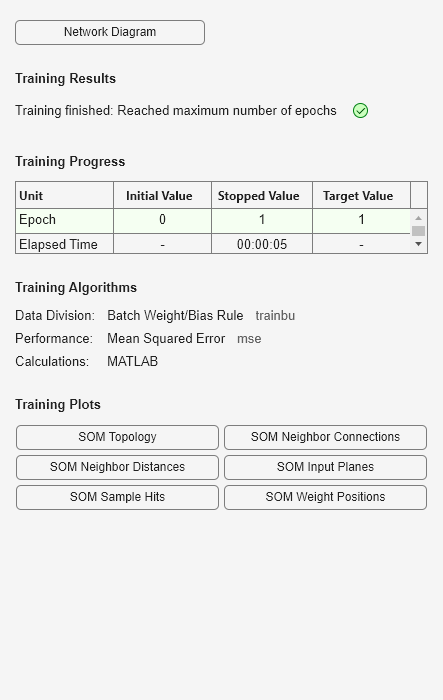
现在我们基于 1000 个向量对映射进行 1 轮训练,并重新绘制网络权重。

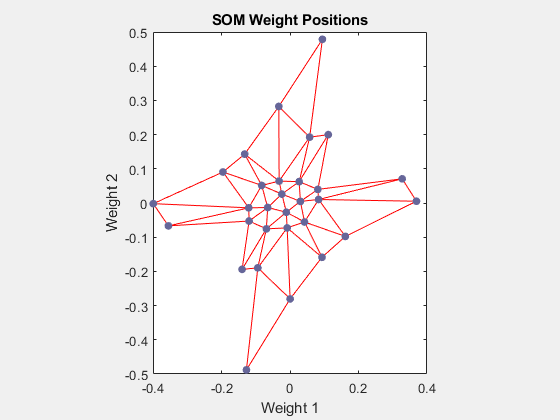
在训练后,注意神经元层已开始自组织,每个神经元现在界定输入空间的不同区域,并且相邻(连接的)神经元对相邻区域作出响应。

net.trainParam.epochs = 1;
net = train(net,X);

Figure Neural Network Training (14-Jul-2025 06:31:59) contains an object of type uigridlayout.

plotsompos(net)

Figure SOM Weight Positions (plotsompos) contains an axes object. The axes object with title SOM Weight Positions, xlabel Weight 1, ylabel Weight 2 contains 3 objects of type line. One or more of the lines displays its values using only markers

现在,我们可以通过将向量输入网络并观察哪个神经元有响应来对向量进行分类。

由“1”表示的神经元有响应,因此 x 属于该类。

x = [0.5;0.3];
y = net(x)
y = 30×1

     0
     0
     0
     0
     0
     0
     0
     0
     0
     0
     0
     0
     0
     0
     0
      ⋮