Code Optimization Using CMSIS DSP Library
This example shows you how to use code replacement libraries for ARM® Cortex®-M processors to generate optimized code for the STMicroelectronics® STM32F4-Discovery board using Embedded Coder® Support Package for STMicroelectronics STM32 Processors.
Introduction
A code replacement library (CRL) is a set of one or more code replacement tables that define target-specific implementations of functions and operators to be used while generating code for your Simulink® model. CRL tables provide the basis for replacing default functions and operators in your model code with target-specific code. The ability to control function and operator replacements allows you to optimize code execution speed, memory footprint and allows you to better integrate external and legacy code with the model code.
The Embedded Coder Support Package for ARM Cortex-M Processors provides a CRL table that replaces the standard ANSI-C code generated for certain Simulink blocks with ARM Cortex-M optimized code from the CMSIS DSP library. The CMSIS DSP library includes a set of controls and signal processing functions such as filters, Fourier transforms, matrix math operations, vector operations, etc. The Cortex-M4 processor uses the ARM DSP SIMD instruction set and a floating-point unit (FPU) to efficiently compute signal processing algorithms.
This example shows you how to use the ARM Cortex-M CRL table to generate code optimized for the Cortex-M4 processor present on the STM32F4-Discovery board. You will learn how to use PIL to get execution profiling measurements and observe the performance improvements obtained while using the ARM Cortex-M CRL table.
Prerequisites
We recommend completing Code Verification and Validation with PIL and Monitoring and Tuning.
Required Hardware
To run this example you will need the following hardware:
STMicroelectronics STM32F4-Discovery board
USB type A to Mini-B cable
Serial communication:
USB TTL-232 cable - TTL-232R 3.3V
Notes:
This example was tested with the FTDI Friend USB TTL-232R 3.3V adapter.

Task 1 - Configure the Model for PIL Simulation
In this task, you will configure a Simulink model to generate optimized code for the STM32F4-Discovery board and you will run a PIL simulation to collect execution profiling measurements.
1. Open the Code Optimization model. This model is configured for the STM32F4-Discovery target. The objective is to create a PIL block out of the FIR subsystem running on the STM32F4-Discovery board. The FIR subsystem contains a 64-tap FIR filter. This model uses the single-precision floating point data type to fully take advantage of the floating point unit of the STM32F4-Discovery processor.
2. Open the Modeling tab and press CTRL+E to open Configuration Parameters dialog box.
3. Go to Code Generation > Interface > Code replacement library and select Arm Cortex-M

4. You can enable PIL from Configuration Parameters > Code Generation > Verification > Create block and select PIL.

Alternatively you can enable PIL for Code Optimization model through running set_param('stm32f4discovery_cmsis_crl','CreateSILPILBlock','PIL') from MATLAB command window.
5. Enable profiling with PIL.
a. Go to Configuration Parameters > Code Generation > Verification
b. Select Measure task execution time, and select Measure function execution times > Detailed (all function call sites) option.

6. Enable PIL communication interface.
a. Go to Hardware Implementation and select PIL
b. Select PIL communication interface > Serial (USART2) and click OK

In this example, the serial communication interface is selected and the COM port corresponding to the USB TTL-232 cable (COM28) is specified in the COM port edit box. Refer to Task 1 of the Code Verification and Validation with PIL and Monitoring and Tuning example for more information on selecting the PIL communication interface.
7. Create a PIL block for the FIR subsystem by following Task 1 - Step 3 of the Code Verification and Validation with PIL and Monitoring and Tuning example.
8. Run a PIL simulation by following Task 1 - Step 4 of the Code Verification and Validation with PIL for STMicroelectronics STM32 Processors Based Boards example.
Task 2 - Inspect Execution Profiling Results
This example shows you how to inspect the execution profiling results collected during the PIL simulation.
1. In Task 1, you ran a PIL simulation to collect execution profiling measurements. The measurements are saved in the firProfile workspace variable. To view a report of the code execution profiling measurements, enter the following command on the MATLAB prompt:
report(firProfile)
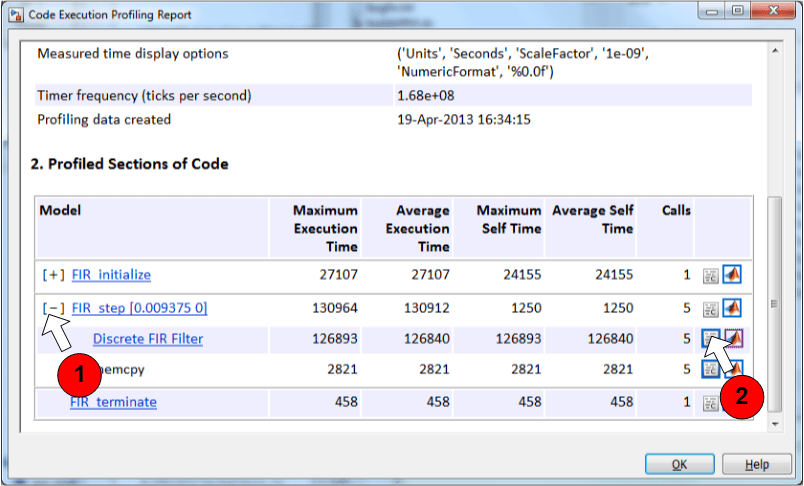
The following report opens and displays execution profiling measurements:

The default unit for execution time measurements is nano second.
2. Expand the FIR_step [0.009375 0] in the profiling report to view the total time spent in the Discrete FIR Filter function, arm_fir_f32, from the CMSIS DSP library. To see the code that corresponds to the Discrete FIR Filter entry in the table, click on the link next to the MATLAB® icon (number 2 in the above figure).
3. Repeat the PIL simulation choosing None instead of ARM Cortex-M as your CRL table. To keep the profiling measurements acquired with the ARM Cortex-M CRL table, change the name of the firProfile workspace variable. Compare the execution profiling results with the 2 approaches. You should notice a significant performance improvement for the filtering algorithm when ARM Cortex-M CRL table is used.
Summary
This example illustrated how to improve the execution time taken by code generated for an FIR filter using the ARM Cortex-M CRL table to replace standard operations with CMSIS DSP library equivalents. The example also introduced the workflow for collecting and analyzing the execution profiling measurements during a PIL simulation.