Perform Fault Analysis on a Motor Drive Speed Sensor
This example shows how to perform a fault analysis on the speed sensor of a motor drive control system. You use Simulink® Fault Analyzer™ to add faults to Simulink signals. After configuring the faults, you link them to a safety analysis spreadsheet, run simulations from the spreadsheet, and use the results to analyze the spreadsheet. The analysis validates whether the control system can mitigate the injected faults.
For more information on defining faults and creating safety analysis spreadsheets by using Simulink Fault Analyzer, see Define and Model Faults and Create Spreadsheets in the Safety Analysis Manager.
Inspect the Model
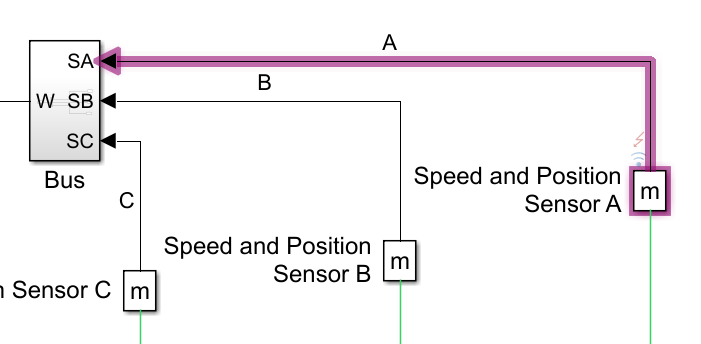
Open the SPMSMDriveSensorFaultTestHarness model. The model contains blocks that represent the physical systems, the controller, and the fault logic. The model takes three measurements of the speed and position of the motor by using the Speed and Position Sensor A, Speed and Position Sensor B, and Speed and Position Sensor C blocks. The model takes these measurements and packages them in a bus. If the Sensor Fault Detection subsystem detects a fault, it sends a message to the PMSM Controller subsystem, which activates the appropriate fault mitigation logic.
mdlName = "SPMSMDriveSensorFaultTestHarness";
open_system(mdlName);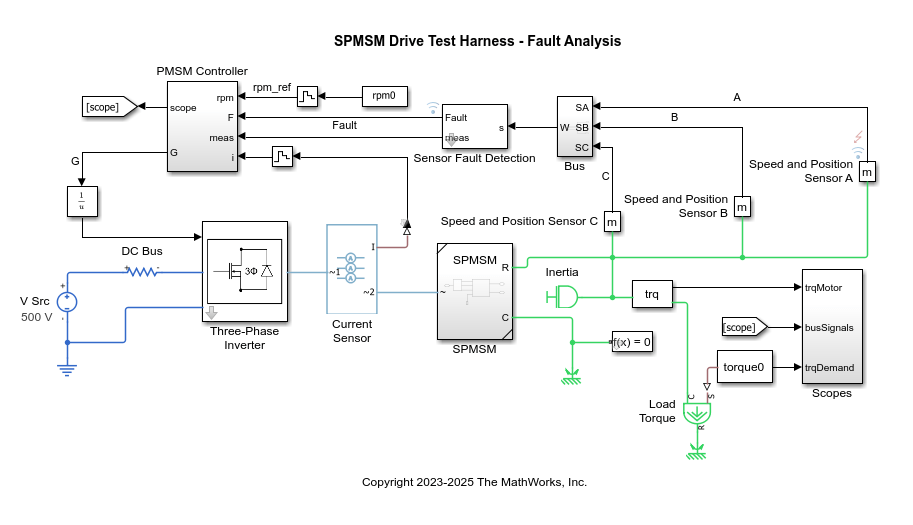
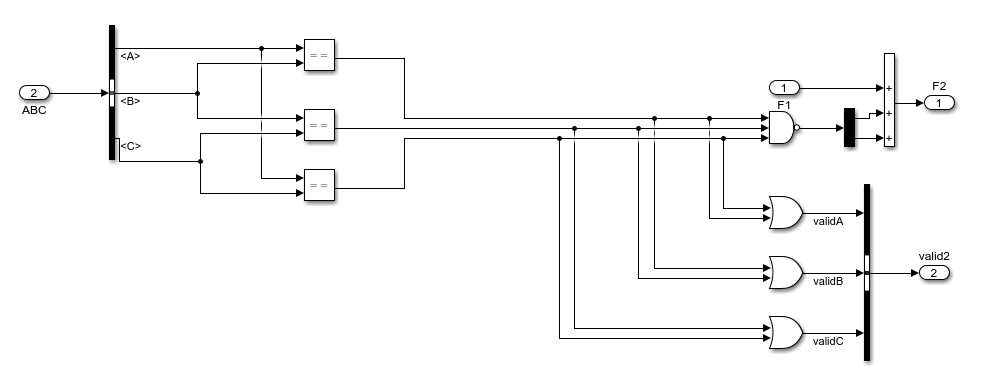
View the Fault Detection Logic
To view the fault detection logic, look in the mask of the Sensor Fault Detection masked subsystem. The subsystem takes an input bus that contains three bus elements. Each bus element represents a measurement of the speed and position of the motor.
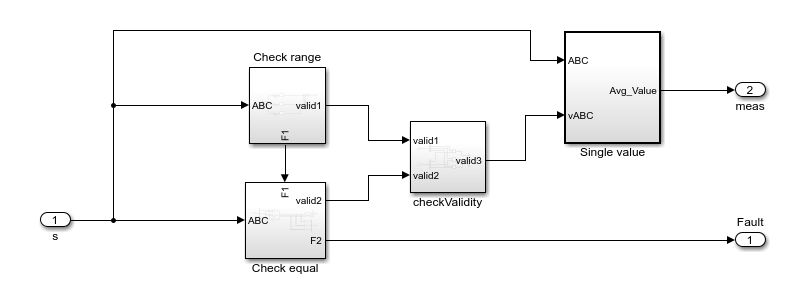
Sensor Fault Detection models two types of fault detection logic in two subsystems:
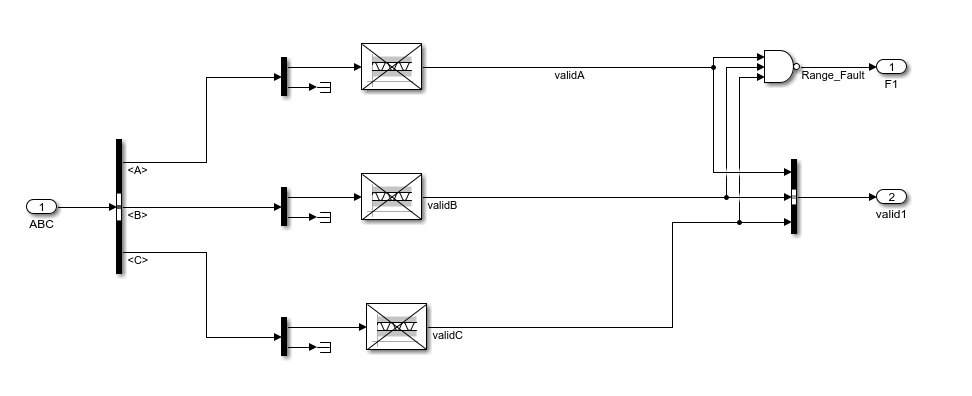
Check range— Detects if the input signal falls outside an acceptable sensor range. If the signal does, the subsystem reports the fault.Check equal— Determines whether one of the three redundant speed and position sensors disagrees with the other two. If the sensor values disagree, the subsystem reports the fault.
Open the subsystems to view the logic modeling. These images show the Check range and Check equal subsystems.
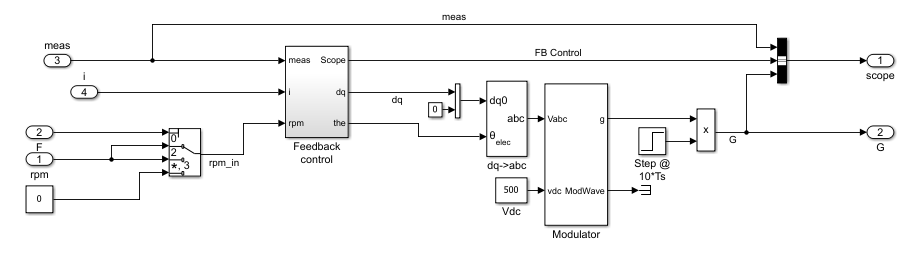
View the Fault Mitigation Logic
From the top model, open the PMSM Controller subsystem. The subsystem implements the fault mitigation logic by using a Switch block:
If one of the three sensors differs from the other sensors, but remains in the acceptable range, the reference revolutions per minute does not change.
If any of the three sensors falls outside the expected range set by the logic in the
Check rangesubsystem, the logic sets the revolutions per minute to0, which triggers a motor shutdown.
Inspect the Faults
The top model contains two faults on the Speed and Position Sensor A subsystem output ports:
An out of range fault — When this fault triggers, the value of sensor A falls outside the acceptable sensor range.
An offset fault — When the fault triggers, sensor A differs slightly from sensors B and C.
Open the Fault Table pane to view and select the faults. In the Apps tab, click Fault Analyzer. In the Fault Analyzer tab, in the View section, click Fault Table. Each fault injects when the simulation time is 0.02 seconds.
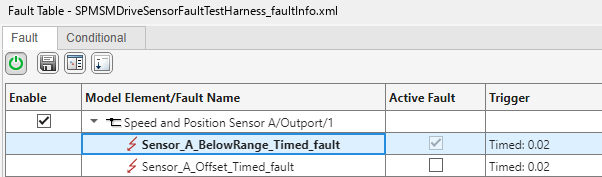
To locate the position of the fault, right-click the fault in the Fault Table pane and click Show faulted model element in canvas.
Link Faults and Tests to Fault Analysis
A fault analysis can differ depending on the application. This analysis often involves determining how effective the detection and mitigation logic are at detecting abnormal system behavior. In this example, you perform a fault analysis to verify that the fault detection and fault mitigation logic of the motor driver deploy when you inject faults.
You model the analysis in a spreadsheet by using the Safety Analysis Manager. While conducting tabular analyses such as Failure Mode and Effects Analysis (FMEA) by using the Safety Analysis Manager, you can:
Establish traceability between items in the spreadsheet and artifacts in MATLAB® and Simulink, such as faults, blocks, and test cases.
Automate analyses by using callback functions that you write in MATLAB.
Verify simulation results to validate assumptions in your analysis.
In this example, you analyze the faults assigned to the output port of the Speed and Position Sensor A block. However, you can extend this approach to test additional faults on the same sensor or other speed and position sensors.
View Test Cases that Simulate Faults
To validate your results, you simulate each fault. To specify the scenarios where each fault is injected, this project includes a test file, MotorDriveFaultInjectionTests.mldatx. Each test case activates one of the faults. Open MotorDriveFaultInjectionTests.mldatx to view the test cases.
sltest.testmanager.load("MotorDriveFaultInjectionTests.mldatx");
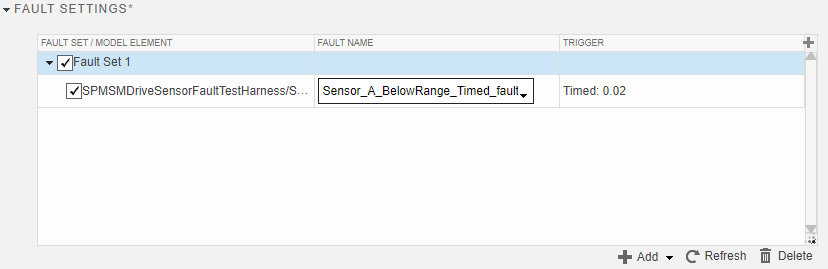
sltest.testmanager.view;In each test case, the Fault Settings section contains the associated fault that enables during simulation. To view the fault set, in the Simulink Test Manager, in the left pane, click Test Browser. Expand the test file and the test suite, and select a test. Expand the Fault Settings section to view the fault set and the faults. This image shows the fault set for the test case that injects the Sensor_A_BelowRange_Timed_fault fault.
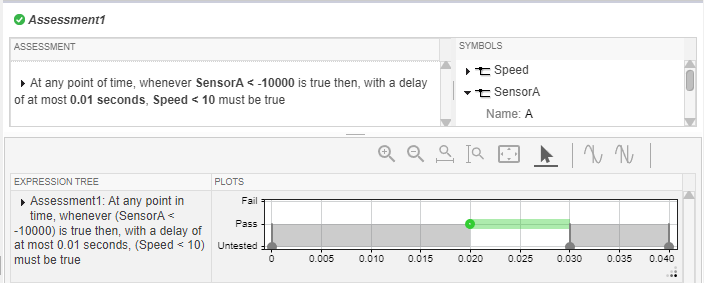
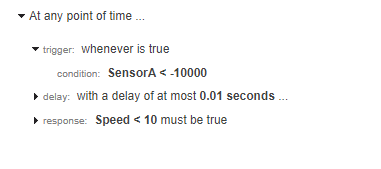
To verify that the test passes, the test includes a temporal assessment. For example, for the Sensor A Below Range Safe Ramp Down test, the temporal assessment checks if the sensor is less than -10000. If it is, the Speed signal must decrease to less than 10 within 0.01 seconds.
View Safety Analysis Spreadsheet
To track the effects of the faults for each test case, each test case links to a row in the analysis spreadsheet, MotorDriveFaultAnalysis.mldatx. Open the MotorDriveFaultAnalysis.mldatx spreadsheet in the Safety Analysis Manager.
MDSSDoc = safetyAnalysisMgr.openDocument(...
    "MotorDriveFaultAnalysis.mldatx");
safetyAnalysisMgr.openManager
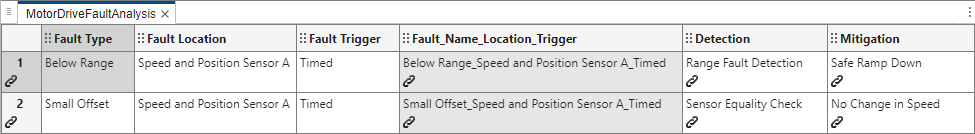
Each row in the spreadsheet links to the associated test and:
Each cell in the Fault_Name_Location_Trigger column links to the fault in the associated test case.
Each cell in the Detection column links to the associated detection logic. In this example, this logic is in the
Sensor Fault Detectionsubsystem.Each cell in the Mitigation column links to the associated mitigation logic. In this example, this logic is in the Multiport Switch block in the
PMSM Controllersubsystem.
Point to a link icon ![]() to view the link information. You can also view the links by selecting the cell and, in the Properties pane, expanding the Links section.
to view the link information. You can also view the links by selecting the cell and, in the Properties pane, expanding the Links section.
Run Callbacks to Simulate and Evaluate Fault Analysis
To analyze the spreadsheet, you create and execute a callback. See Write Callbacks to Analyze Safety Analysis Manager Spreadsheets. In this example, the spreadsheet executes a custom callback, validateWithTests, when you click Analyze Spreadsheet.
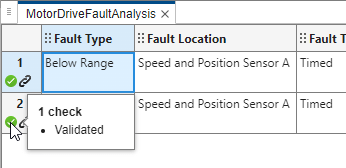
View the callback code. In the Safety Analysis Manager, in the Analyze section, click Edit Callbacks. In the Callback Editor window, click validateWithTests. For each of the rows in the spreadsheet, the callback code checks the links. If the row has a link, the callback retrieves the test case linked to the row and runs the test. If the test passes, the callback adds a check flag to the row. Otherwise, it adds an error flag.
tf = sltest.testmanager.load(...
    "MotorDriveFaultInjectionTests.mldatx");
load_system("SPMSMDriveSensorFaultTestHarness")
tcs = getAllTestCases(tf);

for i = 1:sfa_spreadsheet.Rows
    currentRow = sfa_spreadsheet.getRow(i);
    allLinks = getLinks(currentRow);
    outGoingLinks = allLinks.outLinks;

    if ~isempty(outGoingLinks)
        linkedDest = destination(outGoingLinks);
        testCase = tcs(arrayfun(@(testCase) ...
            strcmp(testCase.UUID, linkedDest.id), tcs));
        result = run(testCase);
            if result.Outcome == "Passed"
                addFlag(currentRow,...
                    "check","Description","Validated");
            else
                addFlag(currentRow,...
                    "error","Description","Validation failed");
            end
    end
end
Close the Callbacks Editor and click Analyze Spreadsheet. The callback verifies that each linked test passes, and therefore that the control system mitigates each fault.
In this example, the links to the faults, fault detection logic, and fault mitigation logic do not affect the outcome of the analysis. However, you can write additional code in the callback that verifies that you define each link, or retrieves information from the linked artifact. For an example, see Perform Fault Analysis of a Battery Management System.
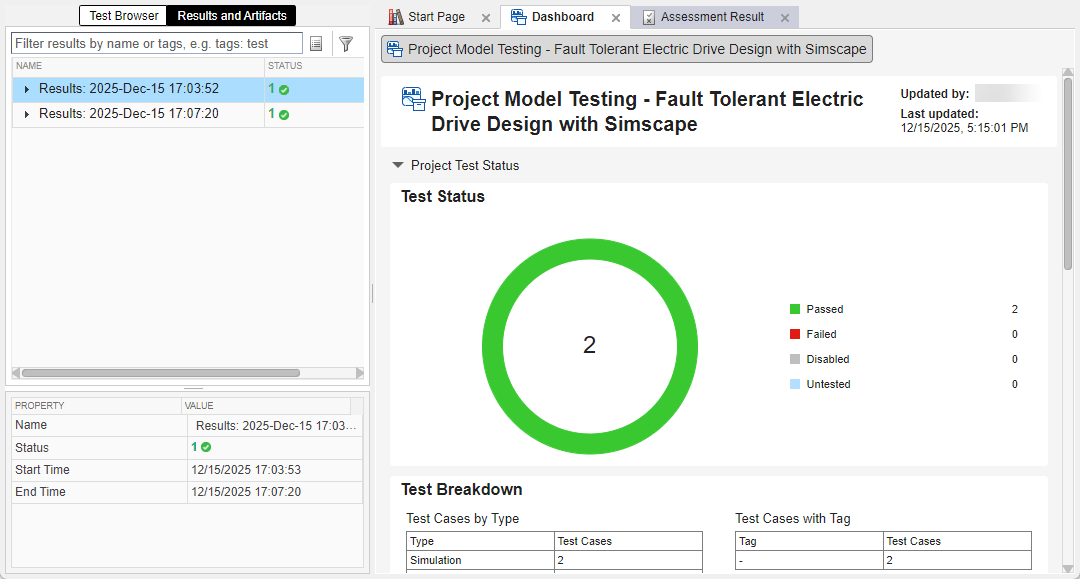
View Test Results
To view the test results, open the Simulink Test Manager. Click the Results and Artifacts tab. To view a summary of the tests that you ran, click a result in the left pane, then click the Dashboard tab.
To inspect the results of each test, in the left pane, expand the test results. Each result contains information about the simulation data and the temporal assessment. This image shows the temporal assessment used for the first test, which indicates that the temporal assessment passed.