解释 surrogateoptplot
surrogateoptplot 绘图函数提供了大量有关替代优化步骤的信息。
最小化有界函数
例如,考虑 surrogateopt 在测试函数 rastriginsfcn 上所采取的步骤的图,当您运行此示例时可用。该函数在点 [0,0] 处具有全局最小值 0。
创建 rastriginsfcn 的曲面图。
ezsurf(@(x,y)rastriginsfcn([x(:),y(:)]));
![Figure contains an axes object. The axes object with title r a s t r i g i n s f c n ( [ x ( : ) , y ( : ) ] ), xlabel x, ylabel y contains an object of type surface.](interpretsurrogateoptplotexample_01_zh_CN.png)
绘制最小化过程
通过给出不对称边界,您可以鼓励 surrogateopt 远离全局最小值进行搜索。设置 [-3,-3] 和 [9,10] 的不对称边界。设置选项以使用 surrogateoptplot 绘图函数,然后调用 surrogateopt。
lb = [-3,-3];
ub = [9,10];
options = optimoptions('surrogateopt','PlotFcn','surrogateoptplot');
rng(100)
[x,fval] = surrogateopt(@rastriginsfcn,lb,ub,options);
surrogateopt stopped because it exceeded the function evaluation limit set by
'options.MaxFunctionEvaluations'.
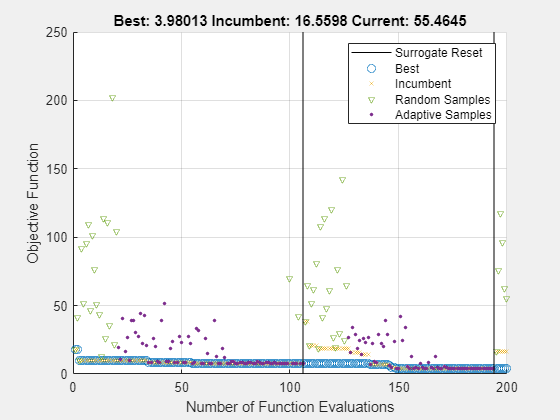
解释图
从左侧开始解释情节。有关算法步骤的详细信息,请参阅替代优化算法。
第一个点是彩色三角形,表示问题边界内函数的准随机样本。这些点在图例中被标记为“随机样本”,来自构建替代阶段。
接下来的点表示自适应点,即在寻找最小值阶段创建的点。这些点在图例中被标记为“自适应样本”。
圆圈(重叠起来看起来像一条粗线)代表找到的最佳(最低)目标函数值。这些点在图例中被标记为“最佳”。在第 30 次评估之后不久,
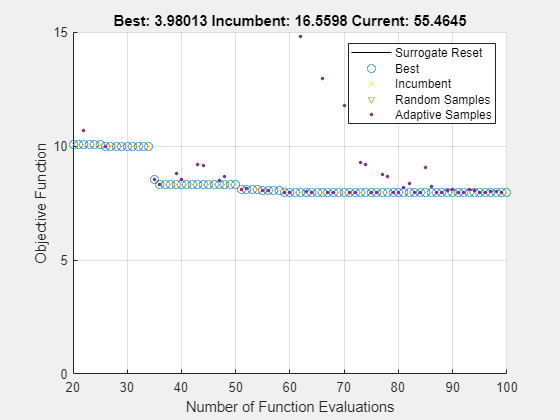
surrogateopt陷入局部最小值,目标函数值接近 8。放大后可以更清楚地看到此行为。
xlim([20 100])
ylim([0 15])
在评估编号 120 之前,有一条垂直线表示替代重置。此时,算法返回到构建替代阶段。
彩色 x 点代表现任者,这是自上次替代重置以来找到的最佳点。
在评估次数接近 150 时,现任者比之前的最佳点有了进步,达到了约 4 的值。放大后可以更清楚地看到此行为。
xlim([140 200])
ylim([0 6])
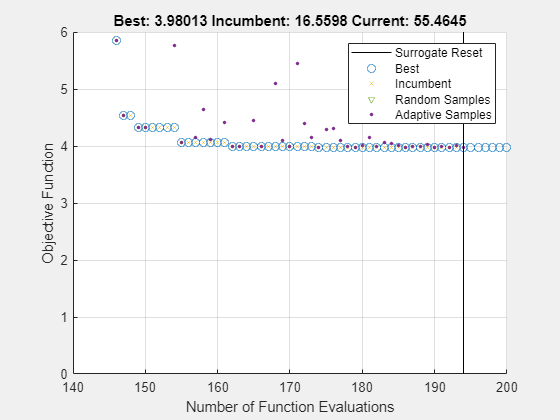
求解器在评估 190 之后有另一次替代重置。
优化在评估次数 200 时停止,因为这是二维问题的默认函数评估限制。
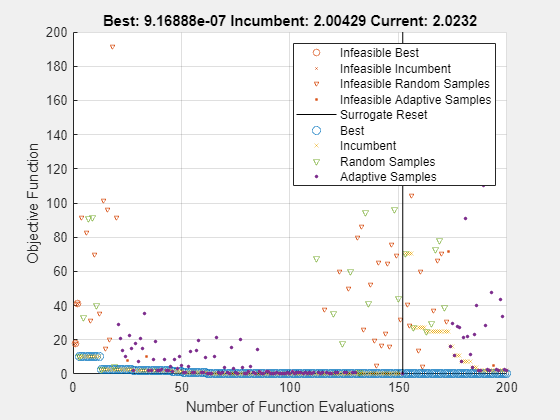
非线性和整数约束
当您有非线性约束时,surrogateoptplot 显示会发生变化。施加 x(1) 为整数值的约束,以及 的非线性约束。有关实现此约束的函数,请请参阅本示例末尾的 rasfcn。
fun = @rasfcn;
通过设置 intcon = 1 来设置整数约束,并运行最小化。
intcon = 1;
[x,fval] = surrogateopt(fun,lb,ub,intcon,options);
surrogateopt stopped because it exceeded the function evaluation limit set by
'options.MaxFunctionEvaluations'.
该图现在在 surrogateopt 评估不可行点的位置显示彩色标记。最终点接近真实最小值点 [0,0]。
disp(x)
   1.0e-04 *

         0    0.6798
整数约束可能有助于 surrogateopt 通过减少搜索空间来找到真实最小值。
function F = rasfcn(x)
F.Fval = rastriginsfcn(x);
F.Ineq = x(1)^2 - 2 - x(2);
end