Profile Generated GPU Kernels for a Sliding Window Algorithm
R2026bThis example shows how to identify performance bottlenecks in generated GPU kernels for an algorithm that computes the variance of a window around each entry of an array. To understand the factors that limit GPU kernel performance, you generate a performance profile for the kernel by using the GPU Performance Analyzer. You then profile the sliding window variance algorithm, analyze the kernel profile metrics, and optimize the MATLAB® code to improve performance.
To profile GPU kernels, you must enable access to performance counters. For more information, see Permission Issue with Performance Counters on the NVIDIA® website.
Examine the Sliding Window Variance Algorithm
The slidingWindowVar function iterates over the elements of an input array and computes the mean and variance for the region around each element. For each element, the function creates a window that contains the element and the next windowSize-1 elements. The function calculates the mean of the elements in the window, and then computes the sum of the squared differences between each element and the mean.
type slidingWindowVar.mfunction [windowVar,windowMean] = slidingWindowVar(X,windowSize)
m = numel(X)-windowSize+1;
windowMean = zeros(m,1);
windowVar = zeros(m,1);
for i = 1:m
W = X(i:i+windowSize-1);
for k=1:windowSize
curr = W(k);
windowMean(i) = windowMean(i)+curr;
end
windowMean(i) = windowMean(i)/windowSize;
diffSquared = (W - windowMean(i)).^2;
s = 0;
for j = 1:windowSize
s = s + diffSquared(j);
end
windowVar(i) = s / windowSize;
end
if coder.target("CUDA")
coder.ceval("cudaDeviceSynchronize");
end
end
Generate a Kernel Profile
To generate a kernel profile, create a GPU MEX configuration object by using the coder.gpuConfig function.
cfg = coder.gpuConfig("mex");Create an input matrix for the function and specify a window size of 3.
in = rand(256,128,"gpuArray");
windowSize = 3;
Call the gpuPerformanceAnalyzer function with the KernelProfile argument set to true. The GPU Performance Analyzer generates code, profiles the application, and then profiles the GPU kernels. This example shows performance data for a machine with an NVIDIA Quadro® RTX® 6000 GPU.
gpuPerformanceAnalyzer("slidingWindowVar",{in,windowSize}, ...
    Config=cfg,KernelProfile=true);
### Starting GPU code generation
Code generation successful: View report

### GPU code generation finished
### Starting application profiling
### Application profiling finished
### Starting kernel range profiling
### Kernel range profiling finished
### Starting profiling data processing
### Profiling data processing finished
### Showing profiling data
Examine Kernel Profile Metrics
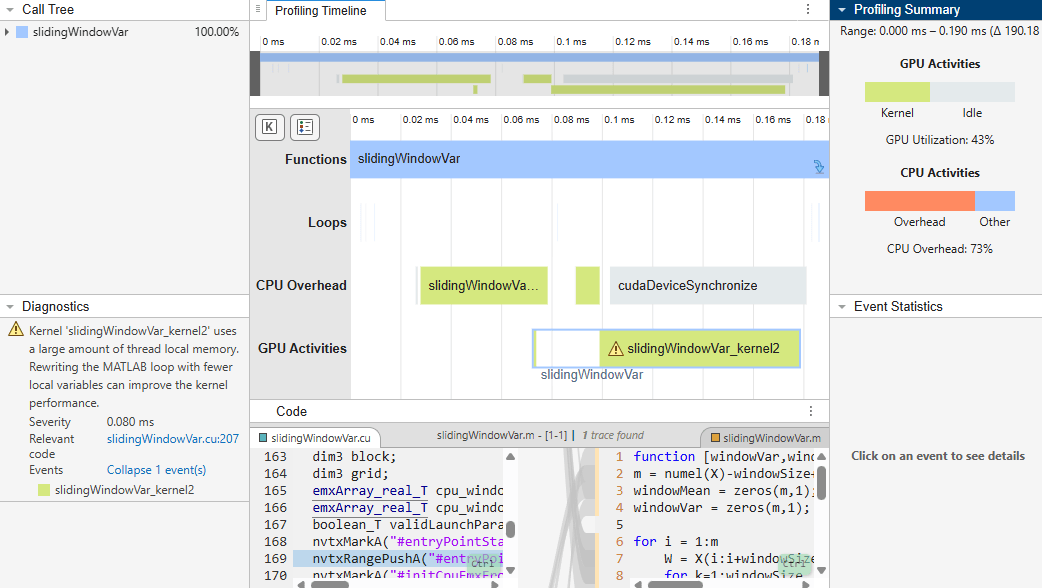
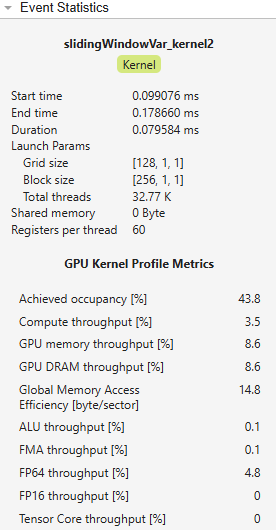
In the Profiling Timeline pane, in the GPU Activities row, select slidingWindowVar_kernel2. In the Event Statistics pane, the Kernel Profile Metrics section shows that the Compute throughput metric is approximately 3.5%. Low compute throughput indicates that the kernel does not use most of the computational capacity of the GPU.
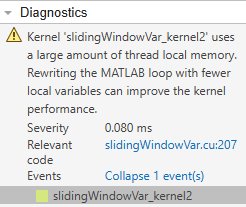
In the Diagnostics pane, the GPU Performance Analyzer reports that the kernel slidingWindowVar_kernel2 uses a large amount of thread local memory.
These metrics indicate that memory latency is restricting the kernel performance. To improve the performance, rewrite the for-loop in slidingWindowVar so that it uses less local memory.
Rewrite the for-loop to Use Less Local Memory
The MATLAB function creates four variables inside of the loop:
The numeric arrays
WanddiffSquaredThe numeric scalars
currands
The loop requires the variables W, curr, and s to calculate the mean and variance of the window. To use less local memory inside the loop, replace the computation that uses diffSquared.
Each iteration computes diffSquared as a three-element array that contains the squared difference between W and windowMean. To compute the output, the slidingWindowVar function uses diffSquared in this code:
diffSquared = (W - windowMean(i)).^2;
s = 0;
for j = 1:windowSize
    s = s + diffSquared(j);
end
windowVar(i) = s / windowSize;
Instead of subtracting the mean from the window W and saving the result as an array, compute the squared difference by using a loop. The code does more computation inside the loop, but it uses less memory to store temporary variables. Use this code to calculate windowVar:
for k = 1:windowSize
    curr = W(k);
    windowVar(i) = windowVar(i) + (curr - windowMean(i))^2;
end
windowVar(i) = windowVar(i) / windowSize;
Save the updated function as slidingWindowVarLoop.
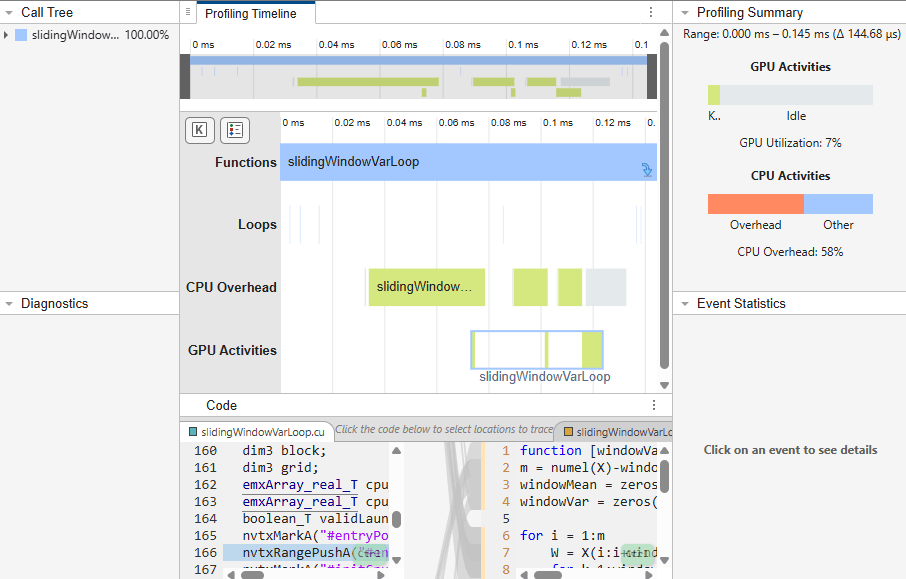
To verify that the kernel has less memory latency, profile slidingWindowVarLoop. The Profiling Timeline pane shows that the code executes for approximately 0.15 ms, which is faster than the 0.19 ms execution time for slidingWindowVar.
gpuPerformanceAnalyzer("slidingWindowVarLoop",{in,windowSize}, ...
    Config=cfg,KernelProfile=true);
### Starting GPU code generation
Code generation successful: View report

### GPU code generation finished
### Starting application profiling
### Application profiling finished
### Starting kernel range profiling
### Kernel range profiling finished
### Starting profiling data processing
### Profiling data processing finished
### Showing profiling data
In the Profiling Timeline pane, select slidingWindowVarLoop_kernel3. In the Kernel Profile Metrics section, the Compute throughput metric increased to 6.2% compared to 3.5% for slidingWindowVar_kernel2. This image compares the metrics for slidingWindowVarLoop_kernel3 with the metrics for slidingWindowVar_kernel2.
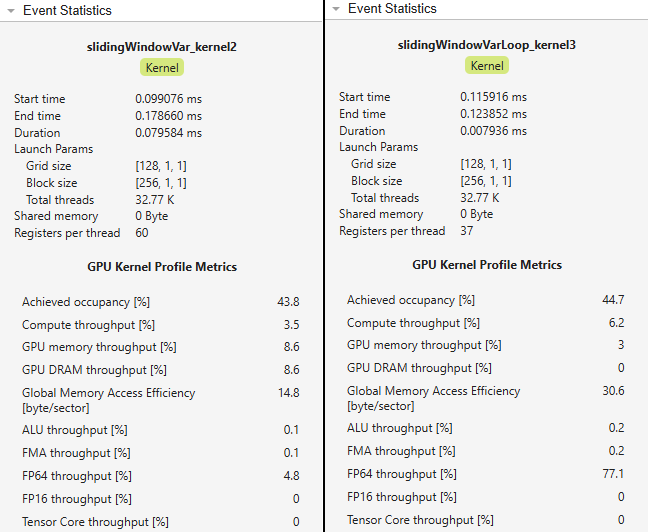
Because slidingWindowVarLoop_kernel3 uses more of the capacity of the GPU, the kernel profile metrics show that the FP64 throughput metric is approximately 77%. High FP64 throughput indicates that double-precision floating-point computations limit kernel performance.
Use Single-Precision Data Types
On NVIDIA GPUs, single-precision operations produce higher throughput than double-precision operations. If the algorithm does not require double-precision accuracy, use single-precision data types to avoid saturating the FP64 pipeline. To create output arrays that match the data type of the input, replace the code that first assigns the windowMean and windowVar variables with this code:
windowMean = zeros(m,1,like=X);
windowVar = zeros(m,1,like=X);
Save the updated function as slidingWindowVarSingle.
Create a single-precision input and profile the function. In this example, the generated code executes for 0.13 ms.
in_single = single(in);
gpuPerformanceAnalyzer("slidingWindowVarSingle",{in_single,windowSize}, ...
    Config=cfg,KernelProfile=true);
### Starting GPU code generation
Code generation successful: View report

### GPU code generation finished
### Starting application profiling
### Application profiling finished
### Starting kernel range profiling
### Kernel range profiling finished
### Starting profiling data processing
### Profiling data processing finished
### Showing profiling data
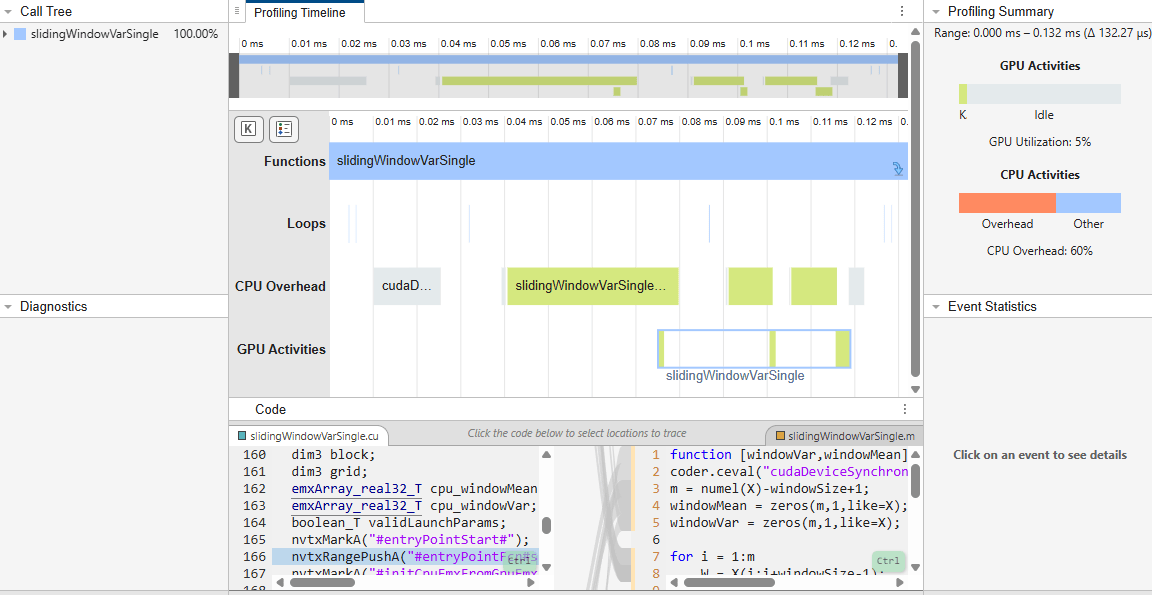
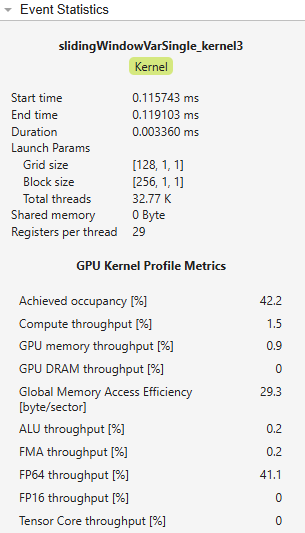
In the Profiling Timeline pane, select slidingWindowVarSingle_kernel3. The Event Statistics pane shows that the FP64 throughput metric is approximately 41.1%.
Helper Functions
The slidingWindowVarLoop function calculates the variance and mean of a window around each element of an input variable, X. The outer for-loop contains another for-loop which calculates the variance of the window.
type slidingWindowVarLoop.mfunction [windowVar,windowMean] = slidingWindowVarLoop(X,windowSize)
m = numel(X)-windowSize+1;
windowMean = zeros(m,1);
windowVar = zeros(m,1);
for i = 1:m
W = X(i:i+windowSize-1);
for k=1:windowSize
curr = W(k);
windowMean(i) = windowMean(i)+curr;
end
windowMean(i) = windowMean(i)/windowSize;
for k=1:windowSize
curr = W(k);
windowVar(i) = windowVar(i)+(curr-windowMean(i))^2;
end
windowVar(i) = windowVar(i)./windowSize;
end
if coder.target("CUDA")
coder.ceval("cudaDeviceSynchronize");
end
end
The slidingWindowVarSingle function also calculates the variance and mean of a window around each element. The function returns the variance and mean as the same type as the input variable X.
type slidingWindowVarSingle.mfunction [windowVar,windowMean] = slidingWindowVarSingle(X,windowSize)
m = numel(X)-windowSize+1;
windowMean = zeros(m,1,like=X);
windowVar = zeros(m,1,like=X);
for i = 1:m
W = X(i:i+windowSize-1);
for k=1:windowSize
curr = W(k);
windowMean(i) = windowMean(i)+curr;
end
windowMean(i) = windowMean(i)/windowSize;
for k=1:windowSize
curr = W(k);
windowVar(i) = windowVar(i)+(curr-windowMean(i))^2;
end
windowVar(i) = windowVar(i)./windowSize;
end
if coder.target("CUDA")
coder.ceval("cudaDeviceSynchronize");
end
end

