主要内容

Visualize Differences Between Floating-Point and Fixed-Point Results

R2026b

To complete this example, you must install the following products:

Inspect Example Files

TypeNameDescription
Function codemyFilter.mEntry-point MATLAB function
Test filemyFilterTest.mMATLAB script that tests myFilter.m
Plotting functionplotDiff.mCustom plot function
MAT filefilterData.matData to filter.
function [y, ho] = myFilter(in)

persistent b h;
if isempty(b)
  b = complex(zeros(1,16));
  h = complex(zeros(1,16));
  h(8) = 1;
end

b = [in, b(1:end-1)];
y = b*h.';

errf = 1-sqrt(real(y)*real(y) + imag(y)*imag(y));
update = 0.001*conj(b)*y*errf;

h = h + update;
h(8) = 1;
ho = h;

end
% load data
data = load('filterData.mat');
d = data.symbols;

for idx = 1:4000
    y = myFilter(d(idx));
end
% varInfo - structure with information about 
% the variable. It has the following fields
%            i) name
%            ii) functionName
% floatVals - cell array of logged original values 
% for the 'varInfo.name' variable
% fixedVals - cell array of logged values for 
% the 'varInfo.name' variable after Fixed-Point conversion.
function plotDiff(varInfo, floatVals, fixedVals)
    varName = varInfo.name;
    fcnName = varInfo.functionName;

    % escape the '_'s because plot titles treat these as subscripts
    escapedVarName = regexprep(varName,'_','\\_');
    escapedFcnName = regexprep(fcnName,'_','\\_');
    
    % flatten the values
    flatFloatVals = floatVals(1:end);
    flatFixedVals = fixedVals(1:end);

    % build Titles
    floatTitle = [escapedFcnName ' > ' 'float : ' escapedVarName];
    fixedTitle = [escapedFcnName ' > ' 'fixed : ' escapedVarName];
    
    data = load('filterData.mat');
    
    switch varName
        case 'y'
            x_vec = data.symbols;
            
            figure('Name','Comparison plot','NumberTitle','off');
            
            % plot floating point values
            y_vec = flatFloatVals;
            subplot(1, 2, 1);
            plotScatter(x_vec, y_vec, 100, floatTitle);
            
            % plot fixed point values
            y_vec = flatFixedVals;
            subplot(1, 2, 2);
            plotScatter(x_vec, y_vec, 100, fixedTitle);

        otherwise
            % Plot only output 'y' for this example, skip the rest
    end

end

function plotScatter(x_vec, y_vec, n, figTitle)
    % plot the last n samples
    x_plot = x_vec(end-n+1:end);
    y_plot = y_vec(end-n+1:end);
    
    hold on
    scatter(real(x_plot),imag(x_plot), 'bo');    

    hold on
    scatter(real(y_plot),imag(y_plot), 'rx');
    
    title(figTitle);
end

Set Up Configuration Object

  1. Create a coder.FixptConfig object.

    fxptcfg = coder.config('fixpt');
  2. Specify the test file name and custom plot function name. Enable logging and numerics testing.

    fxptcfg.TestBenchName = 'myFilterTest';
    fxptcfg.PlotFunction = 'plotDiff';
    fxptcfg.TestNumerics = true; 
    fxptcfg.LogIOForComparisonPlotting = true;
    fxptcfg.DefaultWordLength = 16;
    

Convert to Fixed Point

Convert the floating-point MATLAB function, myFilter, to fixed-point MATLAB code. You do not need to specify input types for the codegen command because it infers the types from the test file.

codegen -args {complex(0, 0)} -float2fixed fxptcfg myFilter

The conversion process generates fixed-point code using a default word length of 16 and then runs a fixed-point simulation by running the myFilterTest.m function and calling the fixed-point version of myFilter.m.

Because you selected to log inputs and outputs for comparison plots and to use the custom plotting function, plotDiff.m, for these plots, the conversion process uses this function to generate the comparison plot.
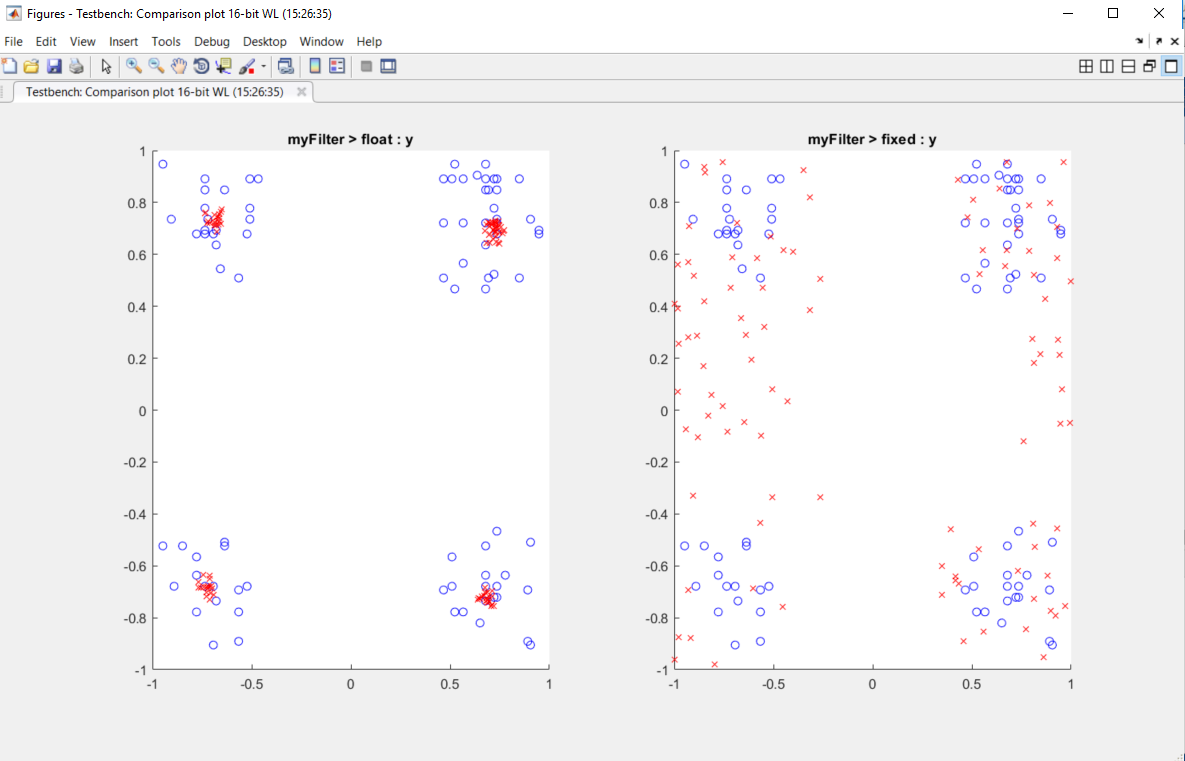
The floating-point and fixed-point plots generated by the plotDiff function are displayed side by side

The plot shows that the fixed-point results do not closely match the floating-point results.

Increase the word length to 24 and then convert to fixed point again.

fxptcfg.DefaultWordLength = 24;
codegen -args {complex(0, 0)} -float2fixed fxptcfg myFilter

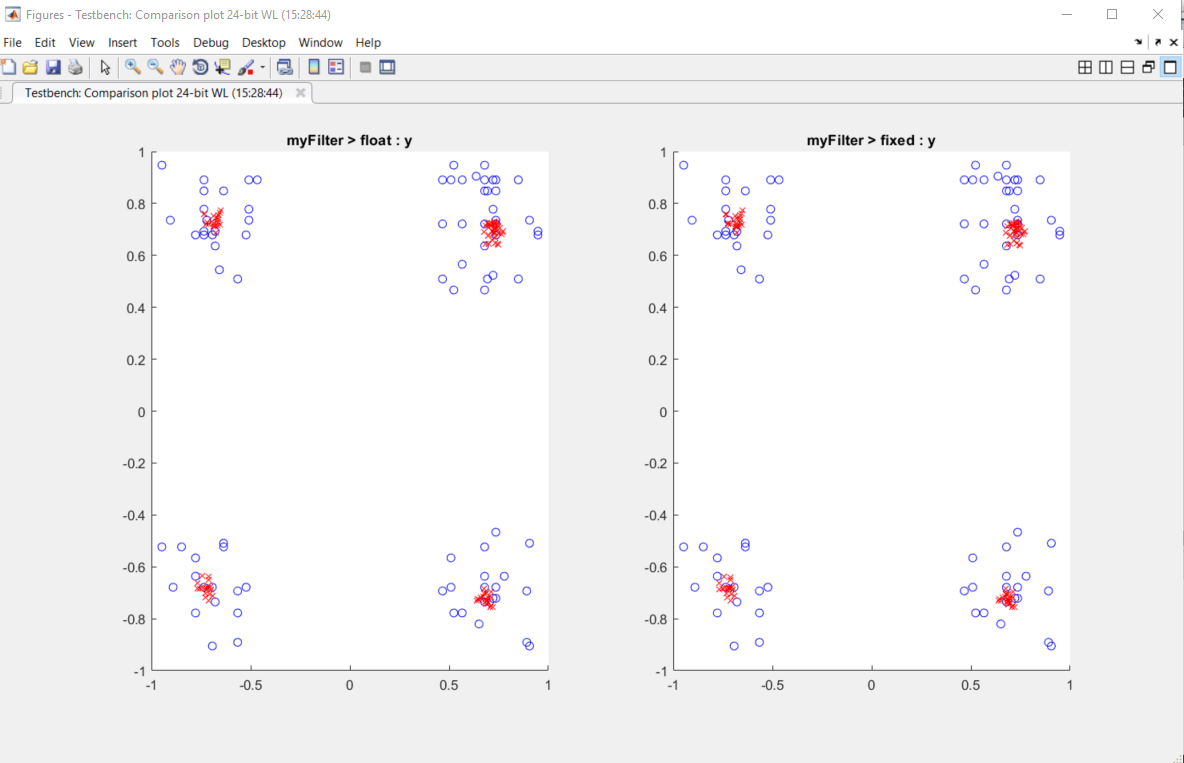
The increased word length improved the results. This time, the plot shows that the fixed-point results match the floating-point results.
See Also

Topics