plot
R2026bPlot OPC UA data in line graph
Description
plot( plots the data in the OPC UA data
object dObj)dObj as a line graph. The function plots each element of
dObj in a value-against-timestamp plot in the current axis. It does not
plot the quality readings.
plot( plots the data in the
axes object specified in dObj,'Parent',AX)AX.
plot( specifies properties of the
line graph using one or more name-value arguments from the MATLAB®
dObj, ...)plot function. Use this syntax to define colors and line styles, or to modify
other properties of the plotted data.
pH = plot( returns the handles to
the line objects in dObj, ...)pH.
Examples
Load the OPC UA example data file and plot the
uaDataVis object.
load opcSampleUaData;
plot(uaDataVis)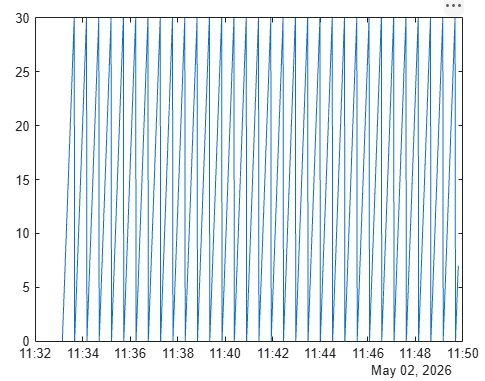
Input Arguments
Version History
Introduced before R2006a

