measureNoise
Measure noise of test chart
Description
esfrChart Object
Use an esfrChart object when you want to automatically detect
gray regions of interest (ROIs). The esfrChart object supports the
Enhanced or Extended version of the Imatest® eSFR test chart [1].
noiseValues = measureNoise(chart)
Test Chart Image (since R2024a)
Use a test chart image for other types of test charts that are not supported by
the esfrChart object. You must identify the positions of the
ROIs.
noiseValues = measureNoise(im,roiPositions)roiPositions for
test chart image im.
Examples
Read an image of an eSFR chart into the workspace.
I = imread("eSFRTestImage.jpg");Create an esfrChart object, then display the chart with ROI annotations. The 20 gray patch ROIs are labeled with red numbers.
chart = esfrChart(I);
displayChart(chart,displayColorROIs=false, ...
    displayEdgeROIs=false,displayRegistrationPoints=false)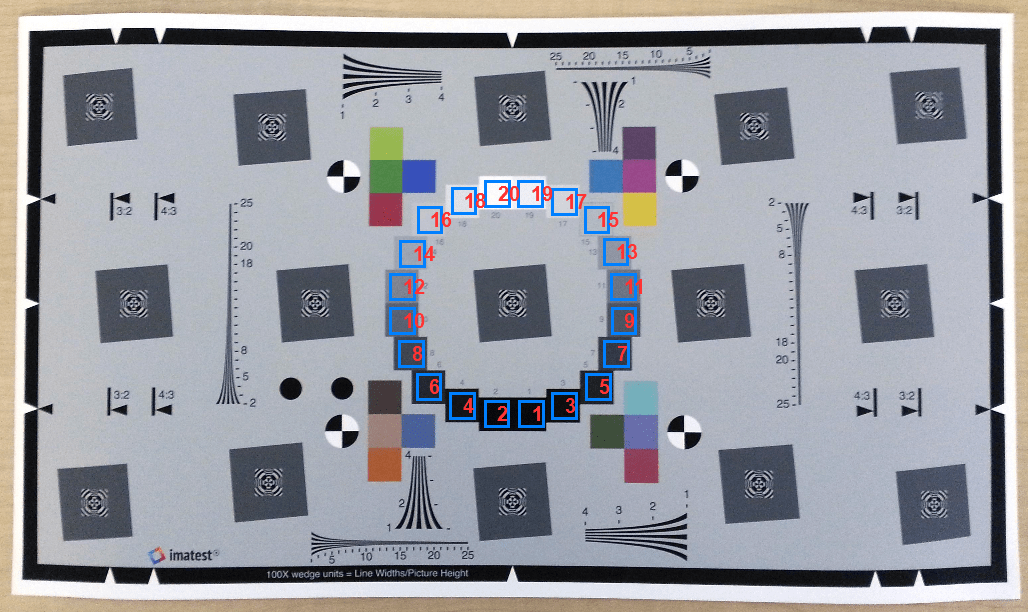
Measure the noise in all gray patch ROIs.
noiseTable = measureNoise(chart)
noiseTable=20×22 table
    ROI    MeanIntensity_R    MeanIntensity_G    MeanIntensity_B    RMSNoise_R    RMSNoise_G    RMSNoise_B    PercentNoise_R    PercentNoise_G    PercentNoise_B    SignalToNoiseRatio_R    SignalToNoiseRatio_G    SignalToNoiseRatio_B    SNR_R     SNR_G     SNR_B     PSNR_R    PSNR_G    PSNR_B    RMSNoise_Y    RMSNoise_Cb    RMSNoise_Cr
    ___    _______________    _______________    _______________    __________    __________    __________    ______________    ______________    ______________    ____________________    ____________________    ____________________    ______    ______    ______    ______    ______    ______    __________    ___________    ___________

     1         9.4147             11.349             11.099           2.6335        1.9417        2.3106          1.0328           0.76145           0.90613               3.5749                  5.8448                  4.8036           11.065    15.335    13.631     39.72    42.367    40.856      1.6708        0.53508         1.0745
     2         9.2873             10.896             10.503            2.405        2.1309        2.0966         0.94312           0.83564           0.82218               3.8617                  5.1132                  5.0099           11.736    14.174    13.996    40.509     41.56    41.701       1.736        0.26598        0.97869
     3         13.488              14.95             15.017           2.4966        2.1156        2.5593         0.97907           0.82964            1.0036               5.4027                  7.0668                  5.8676           14.652    16.984    15.369    40.184    41.622    39.968      1.7942        0.73421          1.053
     4         20.411             21.689             22.946           2.4395        2.0206        2.5556         0.95668           0.79241            1.0022               8.3666                  10.734                  8.9791           18.451    20.615    19.065    40.385    42.021    39.981      1.7945        0.68449        0.84796
     5         29.189             34.144             38.442           3.0436        2.8317        4.1125          1.1936            1.1105            1.6127               9.5903                  12.058                  9.3476           19.637    21.625    19.414    38.463     39.09    35.849       2.304         1.3083         1.1864
     6         35.009             40.337             47.544           3.2201        2.7705        3.6994          1.2628            1.0865            1.4508               10.872                   14.56                  12.852           20.726    23.263    22.179    37.973     39.28    36.768      2.3869         1.2887         1.1016
     7         50.768             58.206             69.539           3.3931        3.2661         3.734          1.3306            1.2808            1.4643               14.962                  17.821                  18.623             23.5    25.019    25.401    37.519     37.85    36.687      2.7733        0.95879         0.7594
     8         61.871              69.98             80.779           3.4734        3.0966        3.1214          1.3621            1.2144            1.2241               17.813                  22.599                  25.879           25.015    27.082    28.259    37.316    38.313    38.244      2.5957        0.54197         1.0178
     9         77.115             83.999             96.869           3.1467        2.9973        3.5088           1.234            1.1754             1.376               24.507                  28.025                  27.607           27.786    28.951    28.821    38.174    38.596    37.228      2.5474        0.88964        0.86929
    10         88.552             98.426             113.87           3.1846        2.8538        3.1835          1.2488            1.1191            1.2484               27.807                   34.49                  35.767           28.883    30.754     31.07     38.07    39.022    38.073      2.4073        0.66975        0.84965
    11         107.25             116.97             132.94           3.3128        3.0561        3.2921          1.2991            1.1985             1.291               32.374                  38.275                  40.381           30.204    31.658    32.123    37.727    38.427    37.781      2.6024        0.74358        0.61288
    12         124.23             131.96             146.27           3.3817        3.0611        3.3879          1.3262            1.2004            1.3286               36.737                  43.109                  43.175           31.302    32.691    32.705    37.548    38.413    37.532      2.5943        0.83876        0.64368
    13         143.52              149.3             164.52            2.922        2.6763        3.0484          1.1459            1.0495            1.1954               49.116                  55.787                  53.969           33.824    34.931    34.643    38.817     39.58     38.45      2.3583        0.63626        0.41777
    14         156.87             165.76             178.05           3.2507        2.6489        2.7331          1.2748            1.0388            1.0718               48.258                  62.577                  65.148           33.671    35.928    36.278    37.891    39.669    39.398      2.2933        0.43831        0.99995
    15         178.25             184.59              193.3           2.8498         2.474        2.6084          1.1176            0.9702            1.0229               62.548                  74.612                  74.106           35.924    37.456    37.397    39.035    40.263    39.803      2.1997        0.32357         0.8789
    16         193.81             196.97             203.42           2.2181        2.1638        2.6139         0.86985           0.84853            1.0251               87.375                  91.029                   77.82           38.828    39.184    37.822    41.211    41.427    39.785      1.8003         0.8909        0.42809
      ⋮
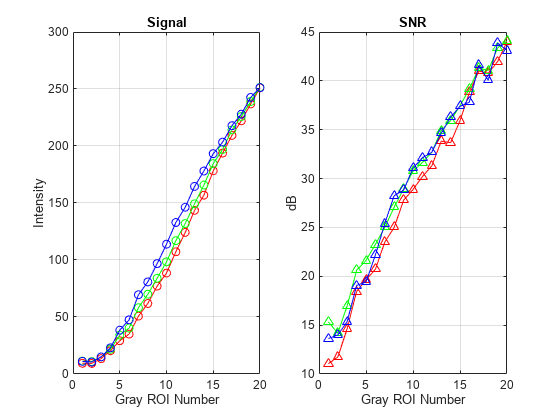
Display a graph of the mean signal and the signal to noise ratio (SNR) of the three color channels over the 20 gray patch ROIs.
figure
subplot(1,2,1)
plot(noiseTable.ROI,noiseTable.MeanIntensity_R,"r-o", ...
     noiseTable.ROI,noiseTable.MeanIntensity_G,"g-o", ...
     noiseTable.ROI,noiseTable.MeanIntensity_B,"b-o")
title("Signal")
ylabel("Intensity")
xlabel("Gray ROI Number")
grid on
subplot(1,2,2)
plot(noiseTable.ROI,noiseTable.SNR_R,"r-^", ...
     noiseTable.ROI,noiseTable.SNR_G,"g-^", ...
     noiseTable.ROI,noiseTable.SNR_B,"b-^")
title("SNR")
ylabel("dB")
xlabel("Gray ROI Number")
grid on
Read and display an image of a custom test chart.
I = imread("RGBColorPatches.jpg");
imshow(I)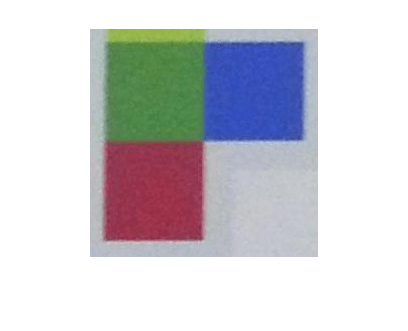
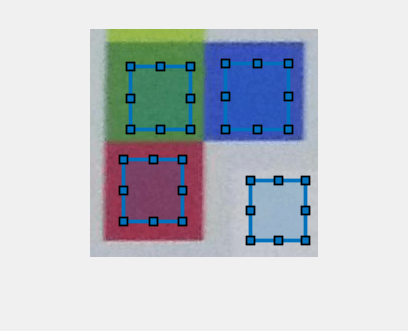
Draw ROIs for the red, green, blue, and gray patches.
numROIs = 4;
roiPos = zeros(numROIs,4);
for cnt = 1:numROIs
    hrect = drawrectangle;
    roiPos(cnt,:) = hrect.Position;
end
Calculate the noise of the ROIs.
noiseValues = measureNoise(I,roiPos)
noiseValues=4×23 table
    ROI    MeanIntensity_R    MeanIntensity_G    MeanIntensity_B    RMSNoise_R    RMSNoise_G    RMSNoise_B    PercentNoise_R    PercentNoise_G    PercentNoise_B    SignalToNoiseRatio_R    SignalToNoiseRatio_G    SignalToNoiseRatio_B    SNR_R     SNR_G     SNR_B     PSNR_R    PSNR_G    PSNR_B    RMSNoise_Y    RMSNoise_Cb    RMSNoise_Cr          ROIPosition
    ___    _______________    _______________    _______________    __________    __________    __________    ______________    ______________    ______________    ____________________    ____________________    ____________________    ______    ______    ______    ______    ______    ______    __________    ___________    ___________    ________________________

     1         153.13             51.698             75.863           3.6607        3.2828        3.6057          1.4356            1.2874             1.414               41.832                  15.748                   21.04            32.43    23.945    26.461     36.86    37.806    36.991       2.529        1.0612          1.6642       34    131     59     62
     2          78.51             135.38             72.137           4.0934        3.2363        3.9369          1.6053            1.2692            1.5439               19.179                   41.83                  18.323           25.657     32.43     25.26    35.889     37.93    36.228      2.8095        1.3295          1.4213       41     38     60     63
     3         54.715             79.381             185.87            3.025        2.7912        3.5732          1.1863            1.0946            1.4012               18.088                   28.44                  52.019           25.148    29.078    34.323    38.516    39.215     37.07      2.3571        1.2146          0.7323      136     35     63     66
     4         194.31             197.07              203.8            2.184        2.0924        2.5672         0.85645           0.82055            1.0068               88.971                  94.184                  79.384           38.985     39.48    37.995    41.346    41.718    39.941      1.6667        1.0141         0.51731      161    152     55     60
Input Arguments
Output Arguments
More About
Tips
To linearize data for noise measurements, first undo the gamma correction of an sRGB test chart image by using the
rgb2linfunction.
References
[1] Imatest. "Esfr". https://www.imatest.com/mathworks/esfr/.